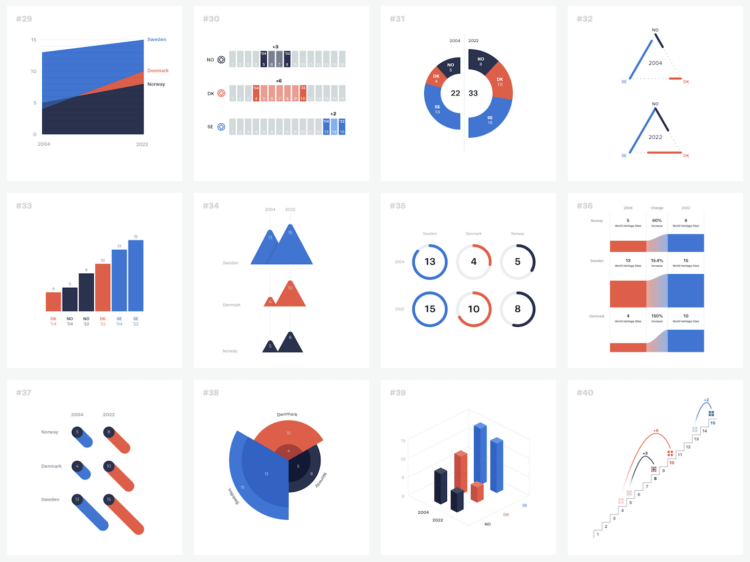
The structure of a dataset can help you pick a visualization method or chart type, but it only takes you part of the way there. To demonstrate, Ferdio started with a simple dataset with six data points and made 100 charts with it:
Every time we turn a set of data into a visual depiction, hundreds of design choices have to be made to make the data tell the best story possible. Many of the choices are unconscious, often resulting in similar solutions. The obvious and uninspired. This project goes beyond common solutions and best practice. It demonstrates how even the simplest dataset can be turned into 100 proper data visualizations telling different stories, using very limited visual properties and assets.
 Visualize This: The FlowingData Guide to Design, Visualization, and Statistics (2nd Edition)