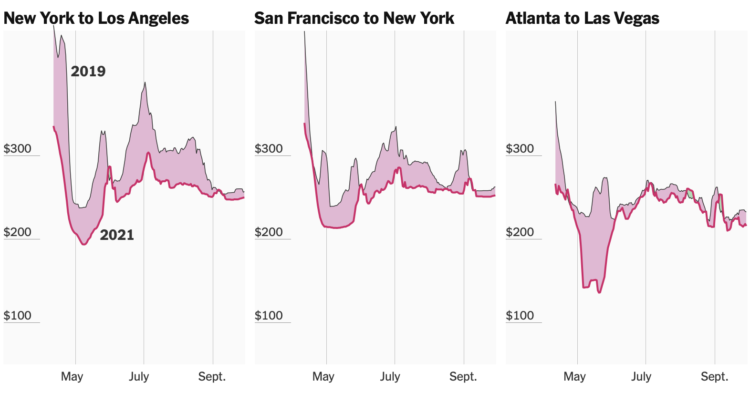
Quoctrung Bui and Sarah Kliff for NYT’s The Upshot used difference charts to show how current airfare prices are approaching 2019 prices, based on data from travel app Hopper. This seems to indicate that people are getting ready to travel again.
Because airfare is typically purchased weeks or months in advance, it can be a barometer of how the public is feeling about the pace of recovery. The prices in the Hopper data, which includes fares displayed over three years of searches (representing billions of flight queries), now suggest a travel recovery that could be in full effect as early as this summer.
The red shade between each line shows the difference between prices year-over-year. Usually the area color in difference charts reflects the metric that is greater, but in these, the area reflects the metric that is less. That confused me for a second. But I’m curious if you’re not familiar with difference charts, do you just see the pattern correctly right away?


