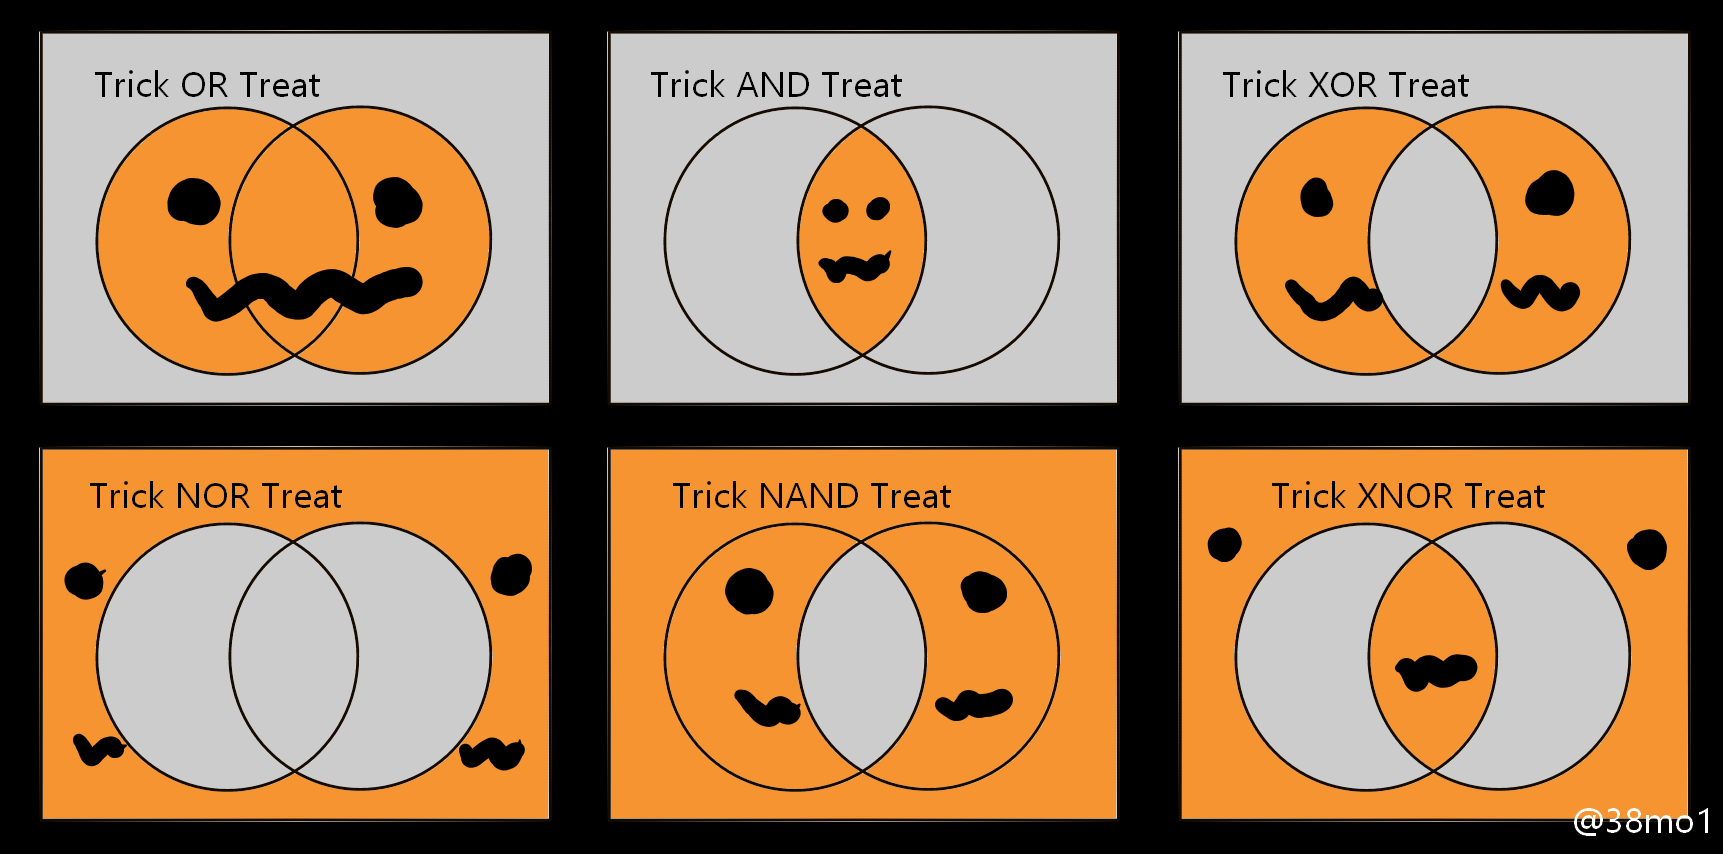
Halloween logicals

Oct 26, 2020

From Kaz Miyamol, these Venn diagrams present very important information about Halloween.

Become a member. Support an independent site. Get extra visualization goodness.

See What You Get

Favorites

Cycle of Many, a 24-hour snapshot for a day in the life of Americans

This is a 24-hour snapshot for a day in the life of Americans.

How Much the Everyday Changes When You Have Kids

I compared time use for those with children under 18 against those without. Here’s where the minutes go.

Finding the New Age, for Your Age

You’ve probably heard the lines about how “40 is the new 30” or “30 is the new 20.” What is this based on? I tried to solve the problem using life expectancy data. Your age is the new age.

10 Best Data Visualization Projects of 2015

These are my picks for the best of 2015. As usual, they could easily appear in a different order on a different day, and there are projects not on the list that were also excellent.