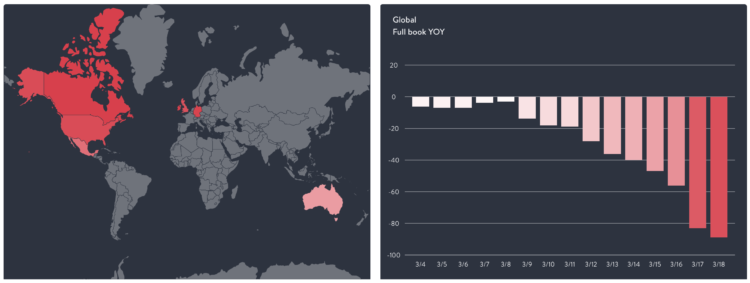
The restaurant industry is taking a big hit right now, as most people are staying put at home. OpenTable provides a downloadable dataset to show how much restaurant dining is down:
This data shows year-over-year seated diners at restaurants on the OpenTable network across all channels: online reservations, phone reservations, and walk-ins. For year-over-year comparisons by day, we compare to the same day of the week from the same week in the previous year. For example, we’d compare Tuesday of week 11 in 2020 to Tuesday of week 11 in 2019. Only states or cities with 50+ restaurants in the sample are included. All restaurants on the OpenTable network in either period are included.
It’s red all the way down. Support your local businesses the best you can.


