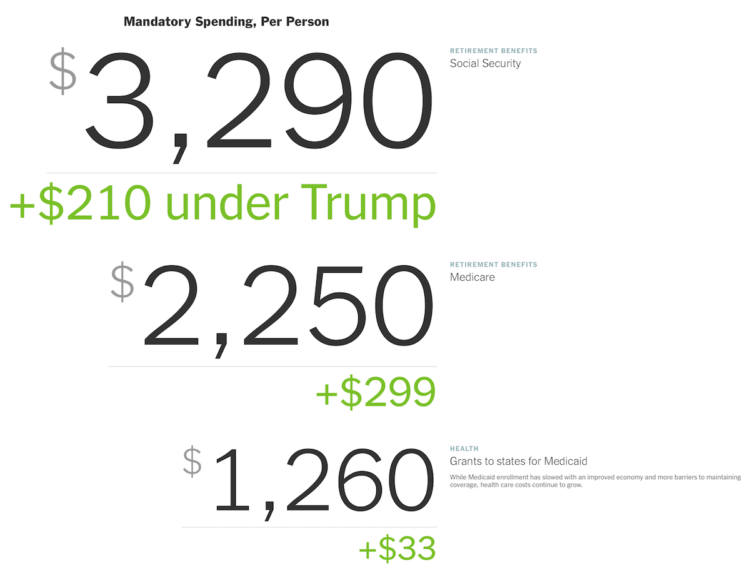
For The Upshot, Alicia Parlapiano and Quoctrung Bui scaled down the federal budget to something more relatable:
To better understand how federal spending has changed since Mr. Trump has taken office, we looked at the actual budget amounts for the 2020 fiscal year. We divided them by the U.S. population and sized the numbers proportionally to make their scale easier to visualize. Then we compared the numbers to the actual budget for the 2016 fiscal year, adjusting for inflation and population changes.
Federal budget visualizations usually aim to show big dollar values going to many different departments. You look at the breakdowns, and you can’t help but think, “That’s a lot of money.” For most of us, it’s hard to imagine billions of dollars, because the scale is so far beyond our own experiences.
So it’s interesting that this piece goes the other direction and scales everything down to match the values to something more familiar. The font size of each value also scales accordingly, which I think in the end is what you end up focusing on.


