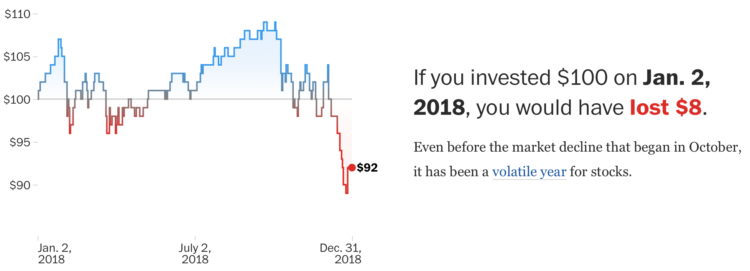
The stock market is in a state. So finicky the past few months. Kate Rabinowitz and Leslie Shapiro for The Washington Post provide a view further into the past for more context to the recent flux. The stretching time axis as you scroll makes for an easy-to-follow visual cue.
Context to the stock market rise and falls
Second Edition
 Visualize This: The FlowingData Guide to Design, Visualization, and Statistics (2nd Edition)
 Visualize This: The FlowingData Guide to Design, Visualization, and Statistics (2nd Edition)
New tools, refined process.