Most Common Jobs, By State

Instead of looking at only the most common job in each state, I found the top five for a slightly wider view. You still see the nationally popular occupations — drivers, cashiers, and retail workers — but after the first row, you see more regional and state-specific jobs.
The sore thumb in this picture is Washington, D.C., whose top five ordered by rank was lawyers, management analysts, administrative assistants, janitors, and, wait for it, chief executives.
Next step: compare metro areas instead of states for something more apples-to-apples.
 Working With Choropleth Maps and Shapefiles
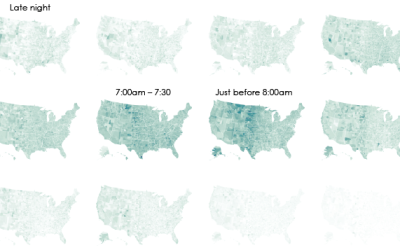
Here’s a tutorial on how to make maps like the above.
Notes
- The Current Population Survey is an ongoing survey conducted by the United States Census Bureau. The downloaded microdata from IPUMS CPS for May 2015 through May 2018.
- I made the maps in R and edited in Adobe Illustrator.
- Like Quoctrung Bui’s map for NPR (which stirred my curiosity), I filtered out the “all other” manager and sales workers, which serve as catch-all categories for jobs that didn’t fit anywhere else.
Become a member. Support an independent site. Get extra visualization goodness.
See What You Get