Many stories don’t follow a linear format. There are flashbacks, or multiple timelines run simultaneously. Story Curves is a research project that tries to visualize the back and forth.
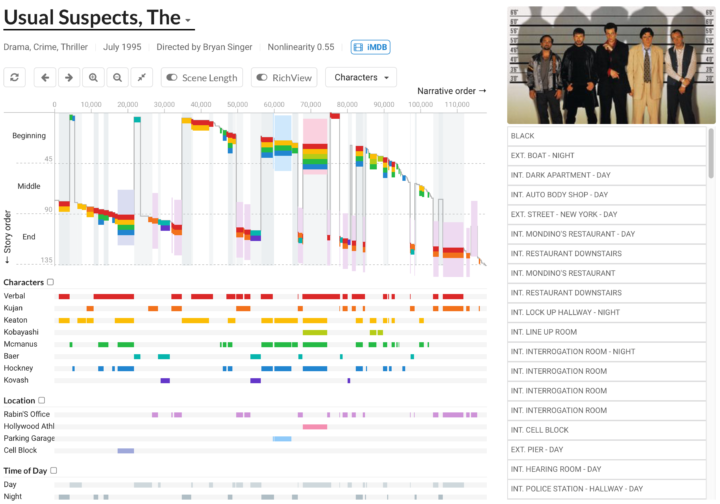
Story curves visualize the nonlinear narrative of a movie by showing the order in which events are told in the movie and comparing them to their actual chronological order, resulting in possibly meandering visual patterns in the curve.
The main part is that top timeline, which shows story order on the y-axis and movie running time on the x-axis. So if you were to visualize a movie that was linear, you’d see a straight line running from the top left corner to the bottom right. For nonlinear movies, like The Usual Suspects, you get a line that fluctuates.
In case the format looks familiar, you might recognize it from The New York Times. They used it to show the nonlinearity of movie trailers, and that piece motivated the Story Curves work. [via @eagereyes]


