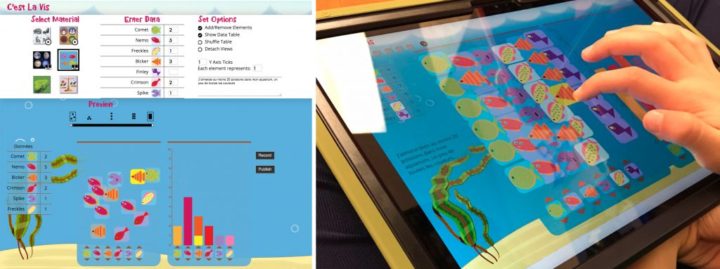
By adulthood, it’s expected that we can read charts to some degree. You’re supposed to know how visual encodings map to data and then interpret. I don’t remember actually learning how to do that though. Do you? C’est la vis is a research project and app that aims to help with that. The project, by Basak Alper from NASA JPL and Nathalie Riche from Microsoft Research, along with Fanny Chevalier, Jeremy Boy, and Metin Sezgin, aims to help kids learn how charts work and help teachers create a curriculum that’s useful.
Hear about their work on the latest Data Stories podcast. A lot of the lessons learned can cross over to teaching grown ups visualization too.
 Visualize This: The FlowingData Guide to Design, Visualization, and Statistics (2nd Edition)