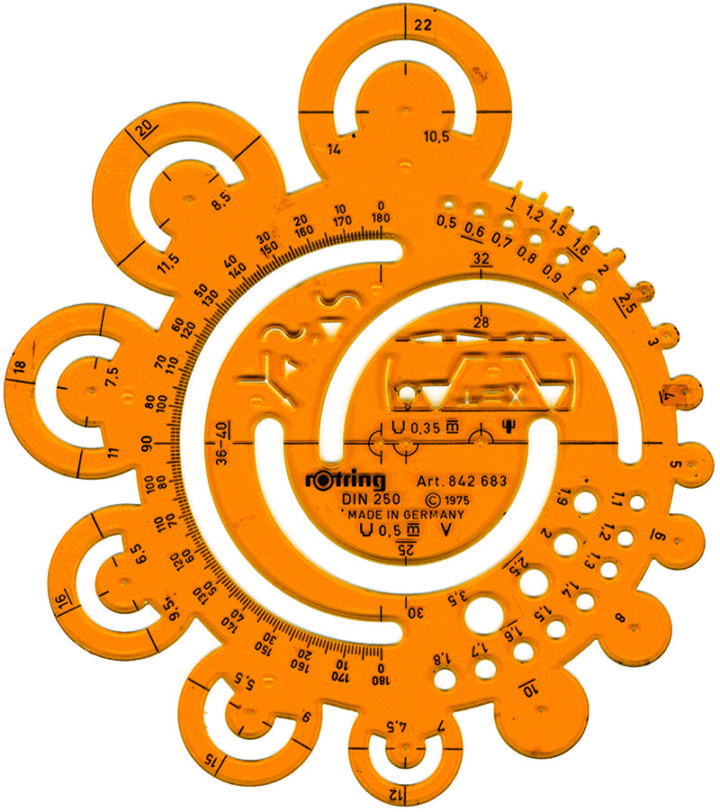
There was a time when charts and infographics were drawn by hand, because computers weren’t affordable or commonplace. John Grimwade provides a run down of the tools he used back in the day. The thing above was used to draw different sized circles. On paper. With a pen.
The tools remind me a lot of my dad’s that he used to have laying around. He’s a civil engineer and used to pull out all these blueprints with measurements and codes. Now they just have giant, high-resolution computer screens.
I wonder what my kids will think of the tools I use when they’re older. “You mean you have to use your hands to visualize your data? That’s like a baby’s toy.”


