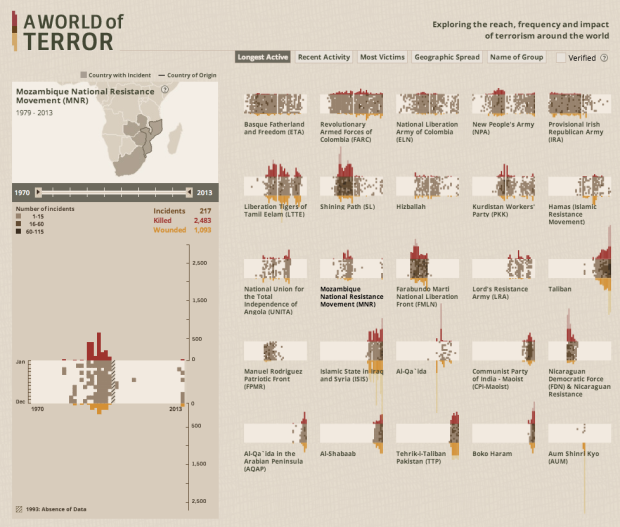
The Global Terrorism Database, maintained by the University of Maryland, is an open source database that catalogs terrorism events since 1970 through 2013. Data visualization firm Periscopic visualized the incident-level data in A World of Terror.
There are over 3,065 organizations and groups listed in the GTD. To identify the top 25 organizations who used terrorist tactics, we determined the groups with the most killings, the most wounded, and the most incidents. We wanted to make sure we were inclusive of all actions, including those that neither wounded nor killed. We aggregated these 3 lists and took the top 25 organizations (most were in the top 30 for all 3 categories). These top 0.8% of groups account for over 26% of the 125,087 incidents.
The midsection of each group shows number of incidents by month and year. The darker the brown, the more incidents on record. Then on the top and bottom shows number of people killed in red and wounded in orange, respectively. Finally, click on the map in the top left for more information about the organization.
Spend some time with this one. Periscopic shows a lot without it ever feeling like too much.


 Visualize This: The FlowingData Guide to Design, Visualization, and Statistics (2nd Edition)
