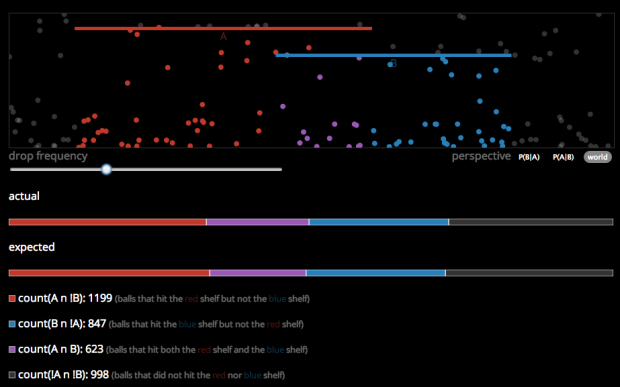
Victor Powell, who has visualized the Central Limit Theorem and Simpson’s Paradox, most recently provided a visual explainer for conditional probability.
Two bars, one blue and one red, represent two events that can happen together or independently of the other. When a ball hits a bar the corresponding event occurs. What is the probability that one event occurs given that the other does and vice versa? If the probability of both events increases and decreases, how does that change the separate probabilities? Sliders and options let you experiment, and the visual and counters change to help you learn.
A fun one to tinker with.


