Twitter mapped all the geotagged tweets since 2009. There’s billions of them, so as you might expect, roads, city centers, and pathways emerge. And it only took 20 lines of R code to make the maps.
Geography of tweets
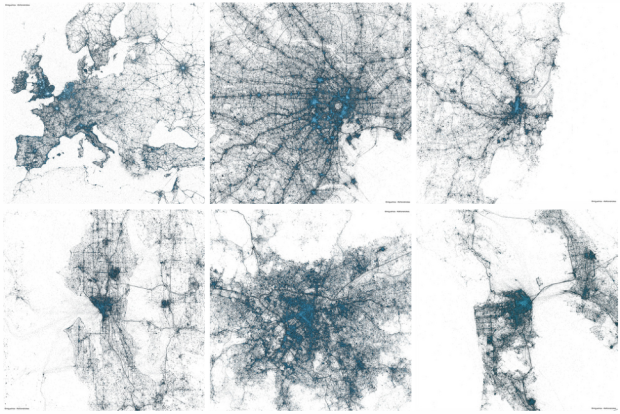
Twitter mapped all the geotagged tweets since 2009. There’s billions of them, so as you might expect, roads, city centers, and pathways emerge. And it only took 20 lines of R code to make the maps.
Pretty interesting. +1 to take the same maps and compare them with world population to get a sense of geo-biases in twitter data. It’ll probably take a few more than 20 lines to get ‘er done, but it would be a compelling view of any biases that we may see in Twitter!
Too bad they didn’t make the data available! Although I guess that would “go against” their “business model” or something.
So where are those 20 lines of code?
Google ggmap. You’ll find quite a few examples.
Are these maps of geotagged tweets or of geotagging tweeters ? A map of communications or of communicating users ?
The former.