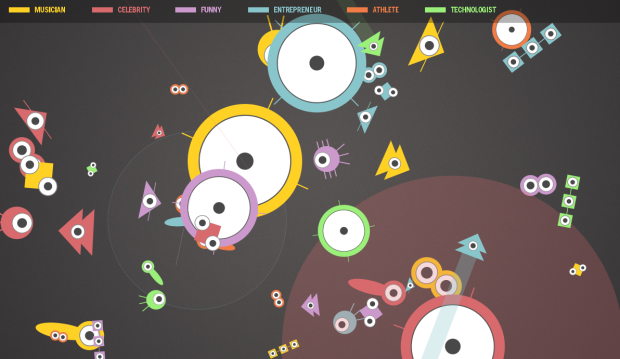
Twitter is a bustling place of tweets, retweets, and replies, and the growth and spread of news can be very organic. After all, there are actual human beings using the service. Kunal Anand, Director of Technology at the BBC, played on this idea of Twitter as an ecosystem and created Tweetures.
After going through an ETL process, I started tinkering with different ways to represent the dataset. While I could have implemented charts or graphs, I really wanted to do something different, something weird. When I took a step back I started seeing Twitter as this ecosystem where organisms (users) act and react to behaviors (tweets/retweets) from other organisms. I thought it would be interesting to think of each Twitter user as a uniquely colored and shaped single-celled organism, or as I call it tweeture.
These Twitter creatures float around, each one representing a person (user). Size and behavior are represent rank, which comes from Infochimps. What each action, movement, and size actually represents in the data, I’m not sure. I’m guessing higher rank means bigger creatures and activity is mostly retweets and mentions.
[Tweetures | Thanks, Kunal]


