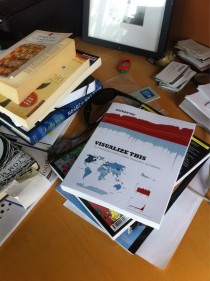
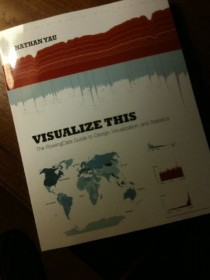
Last week I announced the release of Visualize This: The FlowingData Guide to Design, Visualization, and Statistics, and I have to admit: I was addicted to the listing on Amazon, which shows sales rank, that day. At its peak, it broke the Amazon overall top 100, all the way up to #77. Of course the dust has settled, but it’s still been doing well. I can’t thank you all enough for the support.
Many of you asked if Visualize This would be available digitally. The physical copy came out first, but the book is now available in all of the major eBook formats: Kindle, iPad, and nook. It’s also available on Wiley.
For those who noticed the Kindle version initially cost more than the physical copy, you’ll be pleased to know that the price has come down. It’s an Amazon pricing thing. Apparently Kindle versions of books are higher the first few days they come out.
Sample Chapter
In case you’re on the fence about whether Visualize This is right for you, here’s a sample chapter (Chapter 6, to be more specific) from the book. Obviously, the images are higher resolution in the full version. Also keep in mind this chapter is preceded by others that give you hands-on introductions to Illustrator, R, JavaScript, and Flash.
Data and visualization can be a technical subject, but I did my best to make it an easy read without dumbing it down. If you read FlowingData, you’ll recognize the tone.
What others are saying
Anyways, don’t take my word for it, as they say, here’s what others are saying about Visualize This. This is just some of the great stuff people have been saying on Twitter.
@SecretArtsMedia: @flowingdata has produced an incredible book called Visualize This. If you like data visualization, go and get it: book.flowingdata.com
@machikoyasuda: The @FlowingData book has arrived! Even better than the blog, if that’s possible.
@shadi: YAY!! After MONTHS of waiting, just received my “Visualize This” book by Nathan Yau (@flowingdata), quick browse: very much worth the wait :)
@jgreaves: reading Visualize This (kindle version) Fantastic read, amazing work Nathan @flowingdata thought I might need paper v, but kindle v = great
@Annemcx: taking @nathanyau’s @flowingdata’s book ‘Visualize This’ to bed with me. It’s that good and I’m that geeky.
@peterm95018: Just read the first few chapters of Visualize This. Great read. Gonna get a place next to my Tufte books.
@since1968: “Visualize This” reads like a love letter to python, r, maps, and data. Thanks @flowingdata
@bmarkslash7: It came and immediately got stolen. Looks great @flowingdata http://twitpic.com/5qppc2

@afinefellow: @flowingdata Great book but you kept me up too late reading! There goes my week-end.
@dreeves: Very excited to dig into the new @flowingdata book this weekend! http://yfrog.com/khm5fhoj

@callmephilip: @flowingdata got my copy of #visualizethis : beautiful, insightful and inspiring #thankyou
@kevinpurdy: Awesome day, but now I want to play sick tomorrow. Why? So I can spend all day with @flowingdata’s book
@statpumpkin: My plans for the evening. Congrats @flowingdata!! Only 30 minutes w the book and already learned new things!! http://lockerz.com/s/119882403

@andrewheiss: Geeking out with R Studio, Illustrator, and @flowingdata’s new book.
@southard: Hey @flowingdata, Visualize This. Looks great. Excited. #statsnerd http://yfrog.com/kellsvqj

If you’re enjoying the book, I’d really appreciate a review on Amazon. It’s the best way to help both FlowingData and the book reach a wider audience. There’s one there already (thanks, Stephen Ball) to get it started. Thanks again, everyone. Like I said, without you, this book doesn’t exist.
And if you haven’t gotten Visualize This yet, it’s available at all the major online booksellers (and hopefully actual bookstores soon). Get all the info here.

 Visualize This: The FlowingData Guide to Design, Visualization, and Statistics (2nd Edition)

Germany is still waiting… :(
And I thought amazon.de was already sold out ;)
I just ordered my copy at amazon.co.uk – you even save a few Euros there (26€ incl. packaging instead of 30€).
Now I am looking forward to the delivery date.
Just ordered. Looking forward to it!
@JasonD – Thanks!
Mario – it’s available from amazon.co.uk – not too far away!
I was looking at this and was soo keen to order it ’till I remembered that a copy of it was sitting in an unopened amazon box on my desk :)
UK (I think) is still waiting too… :-(
COOL! Mario is correct! It’s available from Amazon UK.
On page 190, you say to use “pairs(crime2[,2:9], panel=panel.smooth)”, but “plot(crime2[,2:9], panel=panel.smooth)” seems to have an identical result.
@Tim – After using R for a while, you’ll notice that there’s often more than one way to get the same result. The plot() function in particular is a wrapper for a lot of other plotting functions. Code-wise, it can be easier to use plot(), but learning-wise, it’s typically easier to use the more specific functions, because the documentation is more complete.
That’s helpful. Thanks.
And thanks for making this available. I enjoyed reading it and hope to get the book soon.
Mine arrived (UK) on Monday, hooray! Will there be a viz of Amazon sales rank?
@Rob – I’ll look into it :)
Great book. Love it already after reading 3 chapters. Is the web page with code samples up and running yet? The urls on page XXV don’t give what they promise.
@Simon – You can get it on Wiley or here. I didn’t realize the Wiley URL wasn’t working in the book, so thanks for the ping :). I’m working on getting the demos all in one place, but you can also run them locally via the code in the downloads.
What version of Python do you recommend installing to work with the code samples in your book? Python 2.x or Python 3.x?
@Simon – I was working with 2.6 at the time, but I think my technical editor ran all the examples successfully in 3.0.
mine arrived yesterday and i’m thrilled with it… Finally practical advice!
I’ve received mine (in UK) before the estimated arrival date! :D
Ordered it from Amazon a few days ago. Pity it takes two weeks to get all the way to New Zealand! Very excited though.. :-D
Read through my copy, great stuff! Thanks so much for writing it in approachable and practical manner. If I were to teach an intro to visual analytics, I would definitely use this as a text. =)