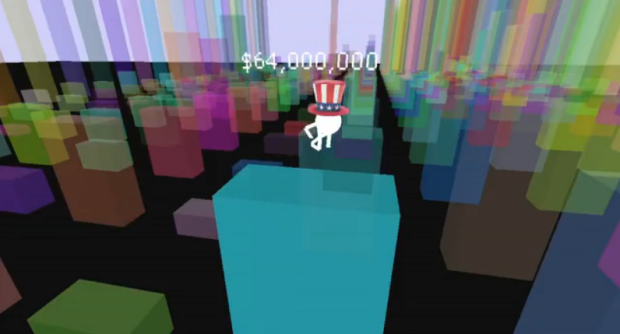
As an entry to the Eyebeam DataVizChallenge to visualize your taxes, Budget Climb by Frankie Cheung, Zach Schwartz, and Fred Truman places you in a virtual environment where you can climb and stand on top of tax data.
Created using openframeworks, the Microsoft Kinect and OpenNI Budget Climb is a physically interactive data environment where we can explore 26 years of federal spending – giving us a unique perspective on how our government spends our money. In order to explore the data we must exert physical effort, revealing how the budget is distributed in a novel and tangible way.
Maybe not the best way to learn about the data, but I like the idea of data exploration as a game. See it in action below. It reminds me of Irad Lee’s Spamology.
[Budget Climb | Thanks, Fred]
 Visualize This: The FlowingData Guide to Design, Visualization, and Statistics (2nd Edition)
for some reason there is no public gallery of entries to datavizchallenge. I’ve entered, not so much to win but to see how others tackle this problem. I assume all contestants are readers of flowing data, so why not post a link to your entry?
mine is here: http://bit.ly/eWX7J9
the ones I found so far –
http://j.mp/gPyk2m
http://labsmb.com/datavizchallenge
http://meghantosh.com/datavizchallenge/index.html
http://dev.humblesoftware.com/dvc/
@jerome My entry is at http://lodes.nu/words_of_the_budget
We’re getting closer to the cyberworld William Gibson described in Neuromancer! Apart from the cool concept, this screen shot shows the limitations of 3-D data visualization: extraneous lines and surfaces. Our little Uncle Sam avatar is going to have a very hard time using the data in the visualization because of all the clutter from unnecessary sides and tops on the cubes.