Katy Börner, professor of information science, catalogs visualization and science in Atlas of Science: Visualizing What We Know.
Cartographic maps have guided our explorations for centuries, allowing us to navigate the world. Science maps have the potential to guide our search for knowledge in the same way, helping us navigate, understand, and communicate the dynamic and changing structure of science and technology. Allowing us to visualize scientific results, science maps help us make sense of the avalanche of data generated by scientific research today.
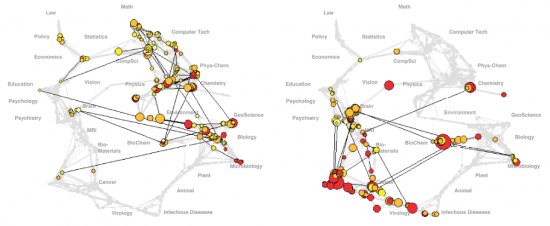
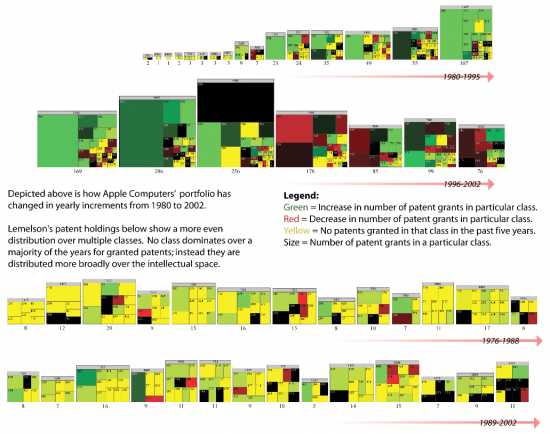
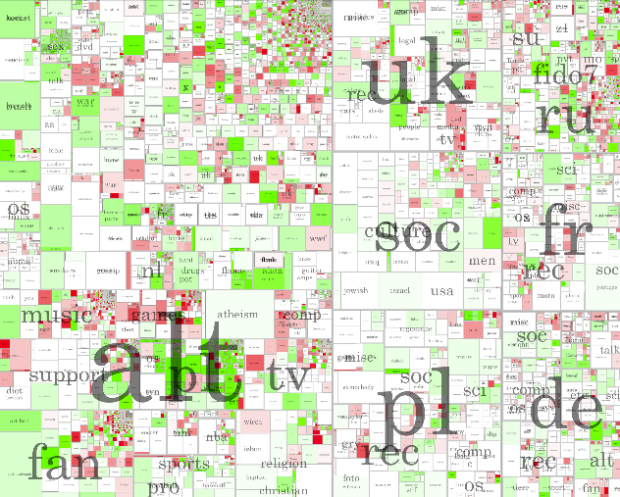
At first glance, without reading anything, it looked a lot like a general scientific visualization book. Sort of like the opposite of Data Flow. Where the visuals lack in aesthetics, they make up for with richness in data and detailed explanations of what you’re looking at. There are a lot of network diagrams, some geographic maps, and a handful of traditional statistical graphics.

Taking a closer look though, I realized that it’s actually much more specific than just a visualization catalog. It really is about “visualizing what we know.” As in: cataloging scientific knowledge. Think of all the books, resources, and academic papers you might find in a library and on the Web, and then think of interfaces and visualizations to access all of that in a meaningful way. That’s what Atlas of Science is about, from the point of view of an information scientist.

All of the visualizations are in color, which is nice, and the book is large at over a foot wide and almost a foot tall, leaving lots of space for full page images.
The strength of the book is that each visual is accompanied by a thoughtful description about the data, how the visualization was built, and what we should see in the picture.
While the book was written for a general audience, I have a feeling the topic might be a little too, for lack of a better word, sciencey for some. There are some very beautiful images in it though, and at under $20 on Amazon, the 288-page hard cover, in-color atlas is a steal if you’re at all interested in the subject. If anything, you’ll learn a thing or two.

For a better idea of the insides, you can actually view all of the high-res images online for free.
Comment to win a copy
Lucky for you there’s a free copy up for grabs. Leave a comment below by Sunday, November 7, 8pm PST, and I’ll randomly select a winner. Complete this sentence. Data is _________. Good luck.
Update: Winner picked. Congratulations to Crystal! Thanks for participating, all.


Data is … plural.
David Marsh of The Guardian:
“It’s like agenda, a Latin plural that is now almost universally used as a singular. Technically the singular is datum/agendum, but we feel it sounds increasingly hyper-correct, old-fashioned and pompous to say “the data are”.
Andrew Garratt of the Royal Statistical Society:
“We don’t have an official view. Statisticians of a certain age and status refer to them as plural but people like me use it in the singular.”
More here: http://www.guardian.co.uk/news/datablog/2010/jul/16/data-plural-singular
Data …are an extract from Signal.
Data is ungrammatical
(the correct form is “data are…”, apologies for the reflex pedantry)
Data are meaningless. Interpretation is everything.
Data is my therapy.
Data is secure.
PS- I was gonna say …. plural. I hate you Mike!
Data is the substance to a decisions
Data is budding knowledge.
great blog, thanks :)
Data is gold!
Data is that Star Trek character
or,
Data is our play thing; Data is what ever a visualization says it is!
Data is powerful!
Data is purely magic.
Data is ‘Tada’ spelled wrong…
Data is raw material.
Data got me where I am today.
Data is truth in a puzzle
Data is … SEXY.
Data is data is data is …
Data is waiting.
Data is the social equalizer
Data is the currency of knowledge.
data is on flowingdata.com
Data was eaten!
Data is a four letter word.
Data are the ingredients.
Data is the Answer to all Questions of Life, the Universe, and Everything.
42 is just the lucky one. :D
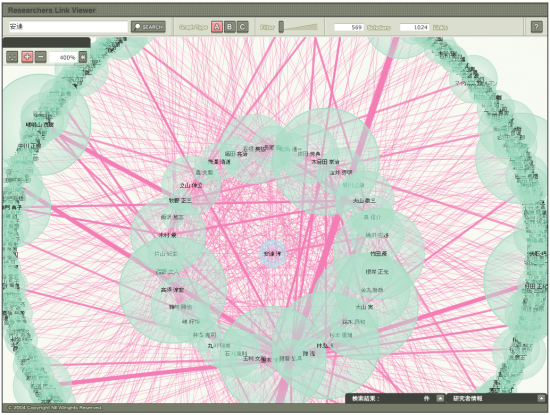
What does the first graphic, “Network Tree Diagram”, have to do with this book, and where did it originate?
Data are what dreams are made of. I heart data.
Data is a 100 letter word in binary.
Data is … good.
Data are power.
Data is the basis of knowledge.
Data are … labor-intensive.
Data is.. a bitch.
(sorry, been a long week of excel-staring – and it’s only Wednesday)
Data is interpreted.
Data is my future.
Data is only the beginning.
Data is Atad backwards.
Data are the atoms upon which molecules of information are built.
data is unsculpted
All your data are belong to us.
Data is… taking up too much space on my hard drive.
Data is a commodity.
It’s the raw material of 21st century. On its own it’s useless, but if turned into meaningful insight, which informs decisions – it becomes the most precious asset.
Data are all around
choose carefully
what you write down
data are colorful
Data is (are) demystifying.
Data is what it was.
“Data is not information, information is not knowledge, knowledge is not understanding, understanding is not wisdom.” -Clifford Stoll
Data is an android from the Star Trek universe.
Data is gold!
Data is as data does. (-:
Data is so far 11 for plural, 38 for singular (counting this).
Gah!! got my email address wrong! Anyway, Data is like water, it acts like a mass noun.
Data is reason.
Data is 42.
data is nothing – information is everything
Data is everywhere.
Data is flowing! Data is also a Star Trek commander :)
All of the data regarding the data are not in.
Data is the echo of human experience.
data is flawed and amazing… data is amazing and flawed.
love
Data is validation.
Data is…what you make of it.
Data is Data Aggregated Transformed Analyzed.
data is not given (datum)
Data is wonderful!
Data is clay.
Data is one pale sonofabitch.
Data is more than the sum of its parts.
Data is an unknown to politicians.
Data are timid
when asked to stand
upon their own
insipid
But brought to bear
the careful eye
parts the clouds
made limpid
Data is before breakfast what most things aren’t until lunch.
Data can be the alpha and the omega but has to start with the right alphabet.
Data is mine.
Data is the new black (and white).
After all these, I still like “data are labor-intensive” the best. Nothing rings closer to the truth!
data is a character on star trek: the next generation
data is the anagram for: ta-da!
data is my gravy train
Data is serving as Science Officer on USS Enterprise :)
http://en.wikipedia.org/wiki/USS_Enterprise_(NCC-1701-E)