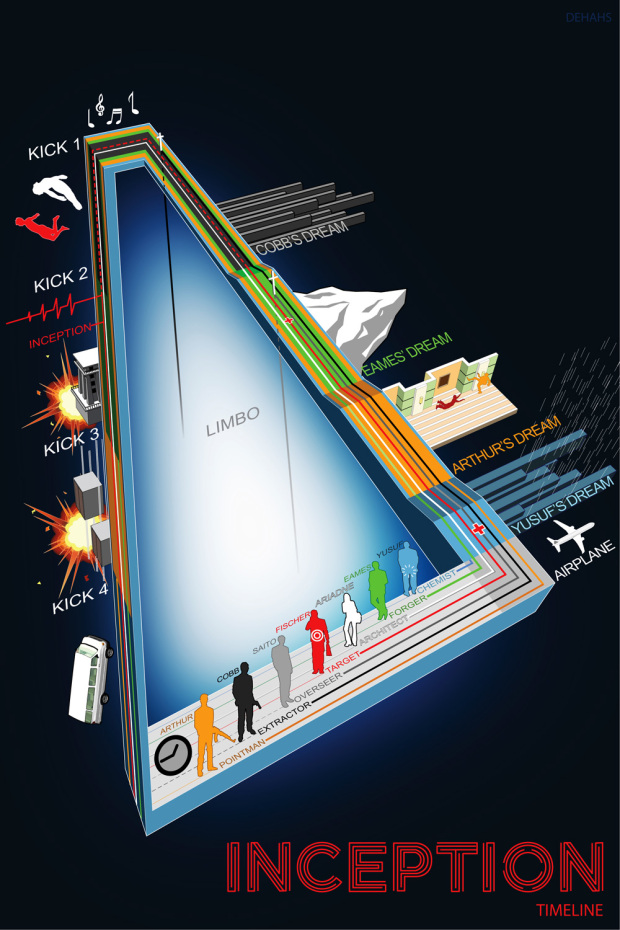
Here’s another timeline of Inception from deviantArt user, dehas. This one has the kicks in it. Start on the bottom left, and follow the character lines counter-clockwise. Lines end as characters die off in each level.
The 3-d angles are a little weird, but doesn’t take away from the graphic too much, if you’ve seen the movie. Joseph Gordon Levitt’s tweet about the graphic just about sums it up: “Diagramming #Inception – The movie itself makes way more sense than this, but it’s a beautiful graphic.” Can’t get a much better recommendation than that.
Which one do you prefer: this one or Sean Mort’s flowchart? Sound off in the comments below.
Also: the confusion still remains. Was level 4 a dream, or did Cobb and Ariadne follow Fischer into Limbo? This graphic shows the former, but Sean revised his showing the latter.
[Thanks, Joshua]


‘The 3-d angles are a little weird’. Not if you consider them a reference to the drawings of M.C. Escher; a great reference given the looped sequences of the artist.
For sure, but I think he didn’t quite the Escher effect here. I do appreciate the reference though.
heya,
Hmm, I this he did, didn’t he?
Try and follow the edge of the box – it seems to twist in on itself.
Cheers,
Victor
I think the 3d angles are a reference to what Arthur did in the movie : a paradox.
There is another 3 beautiful Inception infographics.
Have a look at here please: http://www.pdviz.com/tag/inception
heya,
Woah, that’s a pretty cool site *grins*. Know any others?
Going to bookmark it, thanks.
Cheers,
Victor