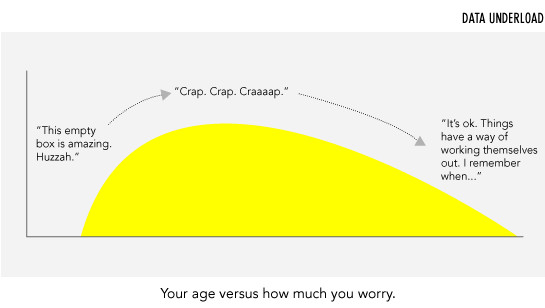
Data Underload #7 – No Worries
FlowingData Delivered to Your Inbox
4 Comments
Second Edition
 Visualize This: The FlowingData Guide to Design, Visualization, and Statistics (2nd Edition)
 Visualize This: The FlowingData Guide to Design, Visualization, and Statistics (2nd Edition)
New tools, refined process.
Pingback: I’ve Said Too Much » Data Underload #7 – No Worries | FlowingData
Nice, Nathan. You make growing old look like fun. :)
ah yes, the adventure that is life.
Pingback: Data Underload #7 – No Worries « nothing to see here