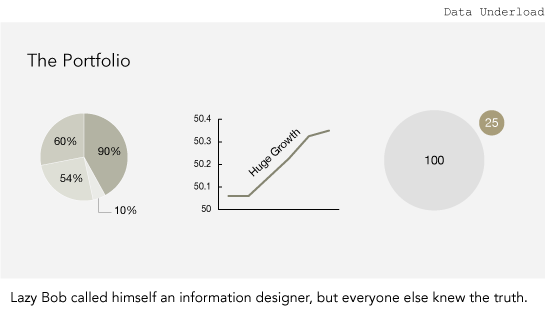
Data Underload #5 – The Portfolio
5 Comments
Second Edition
 Visualize This: The FlowingData Guide to Design, Visualization, and Statistics (2nd Edition)
 Visualize This: The FlowingData Guide to Design, Visualization, and Statistics (2nd Edition)
New tools, refined process.
Lazy Bob is with Fox News right?
maybe. i’m not naming any names :)
Maybe it’s the middle chart, or my filthy mind, or both, but this made me think it was an Enzyte ad for a few seconds.
sometimes… we see what we want to see.
No, it’s the administration – the middle chart is the great improvement in the economy and the last chart shows how much your taxes will go up.