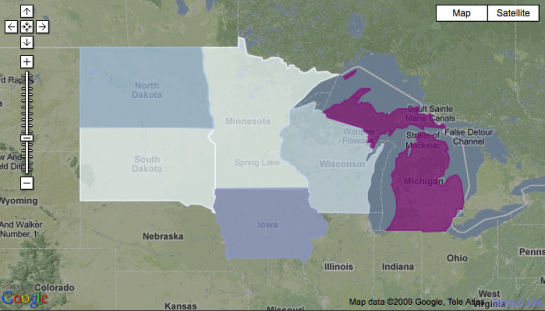
Like it or not, Google Maps mashups continue to be a Web favorite. It’s just so easy to use. Stick a few lines of javascript in your web page, and voila, you’ve got an interactive map. That’s for point-wise data though. It gets a little trickier beyond “you are here” pointers. Cartographic.js, in its first release, aims to make thematic mapping with the Google Maps API easier.
The above is a bubble map for Twitter user locations, and below is a simple choropleth demo.
There’s nothing earth-shattering here, but the above only required a couple lines of code, which I think is something every developer likes to hear.


Looks good for an early release. These maps are becoming more and more popular as the foundation for influential presentations.
I have fallen in love with FortiusOne’s thematic and analytical maps. They made map creation elegantly simple and fun to do.
Very nice. Now, make it work at the county level and my prayers will be answered.
And theses choropleth maps have all the same disadvantage : the size, colour etc. of indicator depends on the size of the area it is to show. So, the wealth of Luxembourg is less important than the one of Greenland.
A basic error that would stop you from passing any first year cartographer/geographer course. But great news on the internet.