StatCrunch and Covariable aim to put statistical analysis on the Web via a graphical user interface (GUI). The former is meant for students in an introduction to statistics course while the latter wants to be a little more; however, both have a lot in common. Here are my thoughts.
Trying to Simplify Analysis With Toolbox
 Through undergrad and graduate school, I’ve always used R for analysis, so performing analyses through a GUI has always seemed a little strange to me. Although I suppose I don’t really have any good reason to feel that way.
I think the main difference between programmatic and clickety analysis is that when you’re doing something programmatically, you need to know what method or tool you want to use before you actually use it.
With a GUI, you tend to have a list of methods (e.g. ANOVA, multiple linear regression) in a menu and you just click on the one you want to use. It’s kind of like a big toolbox of statistical tools that should make analysis easier (since it allows you to avoid all code), but I’m still a bit skeptical.
Why I’m a Skeptic
Statistics is a little, er, make that a lot more than running data through some tests and procedures (otherwise, I’m really wasting my time with this whole PhD in stat thing). The way that Covariable is designed makes me feel like analysis has been taken down a peg or two where there are all these buttons, but not as much context as I would like.
I think the type of people who would use Covariable will (are?) most likely people who don’t completely understand the concepts behind the methods, and the people who do know how would rather use something like R or some desktop tool.
StatCrunch is similar, but doesn’t market itself as a social data analysis tool. Rather it’s more of a learning tool to go with some class (based on the testimonials).
Although I’m still not completely sure about the advantage of the user interfaces of either application over a programming environment like R because code provides you with a certain flexibility that buttons won’t give you. When you’re messing with complex data, you definitely need flexibility.
User Interface Needs to Improve
Both user interfaces are a little jumbled. Even as a stat person, I had trouble navigating, so I can imagine how confusing it might be for someone less experienced.
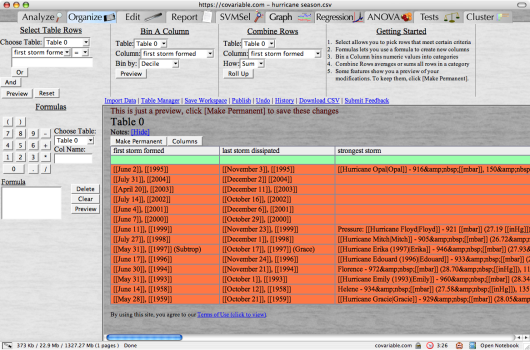
Covariable (as seen below) has a lot of tabs and drop-down menus as well as some ambiguous terminology which adds to the confusion (e.g. bin).
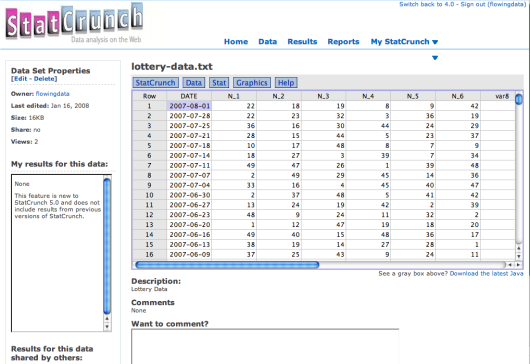
StatCrunch is a little cleaner than Covariable and a bit easier to navigate, but still needs some work.
Both applications are looking very 1990s, which makes me wonder how much development is going on for both. I won’t get into the visualization just to keep things short, but the graph and charts available aren’t anything to write home about.
Final Thoughts
It pains me every time to see stat- and data-related online applications that I can’t give good reviews for, but that just seems to be a trend that we’ll have to change and hopefully, we can aspire to be a bit more than just a tool box. I absolutely want stat, analysis, and visualization to be more available to non-experts; it’s just that there’s still a lot of work ahead for this to happen.
When we judge these social data analysis online applications, which Covariable wants to be and StatCrunch does not, I think we have to ask these questions — Does this application provide an advantage over an Excel spreadsheet emailed to multiple people? Is there any advantage to using the analysis tools online over using those that are already available on our desktop? I can’t quite say yes yet, but I’m looking forward to when I can.
 Visualize This: The FlowingData Guide to Design, Visualization, and Statistics (2nd Edition)
“Does this application provide an advantage over an Excel spreadsheet emailed to multiple people? Is there any advantage to using the analysis tools online over using those that are already available on our desktop? ” Pretty much my criteria for evaluating new tools. I like point-and-click interfaces for teaching introductory classes, since many students have no programming background, otherwise R would be unbeatable.
Covariable’s Visible Statistics has a boxplot! Too bad it can’t be included in the report. Advantage squandered.
However, the Visible Probability pages are very nice demonstrations of the fundamental PDFs, PMFs, and CDFs. I’m using these as a resource for my undergraduate courses.
What do you recommend as a method for keeping an experimental logbook for these sorts of statistical explorations?
I’ve found it’s sometimes easy to get ‘carried away’ by the ease of doing lots of exploring, which can lead to over fitting and meaningless discovery. I was thinking a more integrated technique of keeping track of my hypothesis in advance, might help.
What do you use?
I think that once you get comfortable with the tools available to you, it gets a lot easier to go straight to the tool you want to use.
When you need to unscrew something, you won’t go through the whole toolbox before finding the screwdriver or reach for the saw when you need to hammer a nail.
Thanks for the excellent review.
I fail to see the need for applications such as Covariable (web based or otherwise). I can’t imagine it has anywhere near the computing power of software like R. At $19.95 a year (that is if you want to do such frivolous things as ANOVA, multiple or non-linear regression, and hypothesis testing) vs. $0 for R, the makers of Covariable are kidding themselves.
StatCrunch, on the other hand, does seem to have value as an educational tool. It looks like it might be fun to play with.
I totally forgot about that $19.95 sticker. Yeah, that definitely does bring up some problems doesn’t it?
I just stumbled on this review while googling StatCrunch. As the author of StatCrunch, I must say that I find it a little ridiculous. This is clearly written by someone who has yet to get a PhD in statistics and not by someone with more experience in statistical education or statistical consulting. It is is really a classic fixation on R that most graduate students develop these days as they use it to complete their research. They naturally then assume that this what everyone should use. What they do not understand is that outside of statisticians almost no one uses R. Folks simply will not take the time to learn a programming language when they want to practice basic statistics. No one says “Let me find the R function to do a simple hypothesis test.” Not to mention the function to read data. Many instructors have tried to use R in introductory statistics and almost all have failed miserably. It simply has no presence in statistical education.
I find the remarks about the StatCrunch user interface extremely odd. This aspect is what most of the 100,000 annual users seem to like best about StatCrunch compared to other packages. StatCrunch is definitely still under development with a major release in August of 2007. It seems that Nathan did not do his homework on this piece of the evaluation. His comments are even more odd when you take into account that he uses R which has a 1960s interface. What does a 2000ish program look like?
The question posed in the last paragraph shows that Nathan really has no idea what he is talking about. The advantages over emailing an Excel file are numerous.
First, the Excel issue. Have you ever tried doing basic groupings in Excel (a pivot table nightmare!), and of course, often times P-values in Excel are wrong. StatCrunch also has interactive graphics which means you can highlight observations in a graph to see where they are located in the data table and in other graphics. This feature is very nice to have when teaching/learning statistics. Excel does not have this sort of feature. Simply put Excel is a spreadsheet program that some folks try to use for statistics but it simply does not work very well.
Now on to social data analysis where Nathan’s comments are most disturbing. Think for a moment about a statistics course where an instructor wants to share data sets with a large group of students. With traditional desktop software, each student would need to obtain the software and install it on their machine. Then using Nathan’s suggested approach, the instructor would need to email each data set to every student. Each student would then in turn have to go though the steps to load the data set. With StatCrunch, an instructor can simply point the students to his or her public profile. Students then can immediately start analyzing data by clicking on linked data sets with no need to install any software at all. Students can also access the software from any online location and are not limited in terms of where they can work. They save their work on the StatCunch server so they can access it in the future or share it with others. With StatCrunch, they can even prepare online project reports combining data and analysis results to be shared with their fellow classmates and their instructor.
I apologize for my lengthy response here, but this review is really really lacking.
Sorry, I didn’t mean to cause any insult. I think I made a mistake in combining a review of both StatCrunch and Covariable into one post; much of what I said was meant for the latter (but still some for the former). That being said, let me clarify some miscommunication and well, defend myself :)
I’ll start with my “fixation on R.” I wasn’t trying to suggest that people use R in lieu of something GUI-based. All I meant was that it felt weird to me, because I’ve always learned analysis with R at both my undergrad at Berkeley and graduate education at UCLA. Nothing more.
In fact, R isn’t even my weapon of choice (although I do still think it is very useful). My focus is in design and data visualization so I’m usually in Illustrator or immersed in actionscript. I won’t try to argue that R belongs in stat education (I think it does); that discussion could go on forever.
From a design perspective, the StatCrunch UI does need work; however, I guess I should note that StatCrunch is a bit better than Covariable in this regard. But still, ask any designer, and I’m absolutely sure they will agree that there’s a lot of room to improve ease of use. As for that 1960s remark, well, R is a programming language. Write a script and run it. What’s current? Look at any web app on TechCrunch. There is a clear difference between apps today and StatCrunch’s collection of applets.
Onto the definition of social data analysis. We clearly have very different views on what this is. I was referring to the ideas made popular by Wattenberg et. al. – a group of people analyzes a single dataset together and comes to some kind of consensus. StatCrunch isn’t trying to do this, is it? Covariable I think is trying.
Anyways, in my efforts to keep things short — as an educational tool, StatCrunch does have potential but can still stand to undergo a lot of changes. Covariable is not trying to cater to education, which I believe is a problem.
Looking forward to the August 2008 (I’m assuming that’s what you meant) update.
I promise not to launch into another diatribe here. StatCrunch has been around for over a decade and went through 5 releases, the last of which was in August 2007. It has been reviewed many times and many articles have been published about StatCrunch, two of which are in the Journal of Statistical Software housed at UCLA. Many instructors have done usability studies and found that students prefer it to desktop packages. StatCrunch is not intended (at least not yet) for the study of large complex data sets, but rather it is constructed so that people can effectively do the types of analyses that they are taught in basic statistics courses. Not all data sets (maybe not even a high percentage) are overly complex. People do t-tests, ANOVA, etc.. every day.
By the way, I use R almost exclusively for my statistical research in my day job as a professor of statistics at Texas A&M University.
We have the same definition of social data analysis by the way. In some sense, folks in statistical education have been doing it for a number of years in the form of small group projects. The internet has brought the ability to do this with with a much larger number of people. I am most excited about the possibilities for scientific insight and learning that these online collaborations may be bring about.
What I described above are some of capabilities that StatCrunch brings to the table for social data analysis in an educational setting. This aspect of the site has only been available since August 2007 and already thousands of data sets and results are being shared and discussed on the StatCrunch site. You can access them by clicking the appropriate links at the top of the StatCrunch web page. So, I definitely have in mind to take StatCrunch more into the realm of social data analysis.