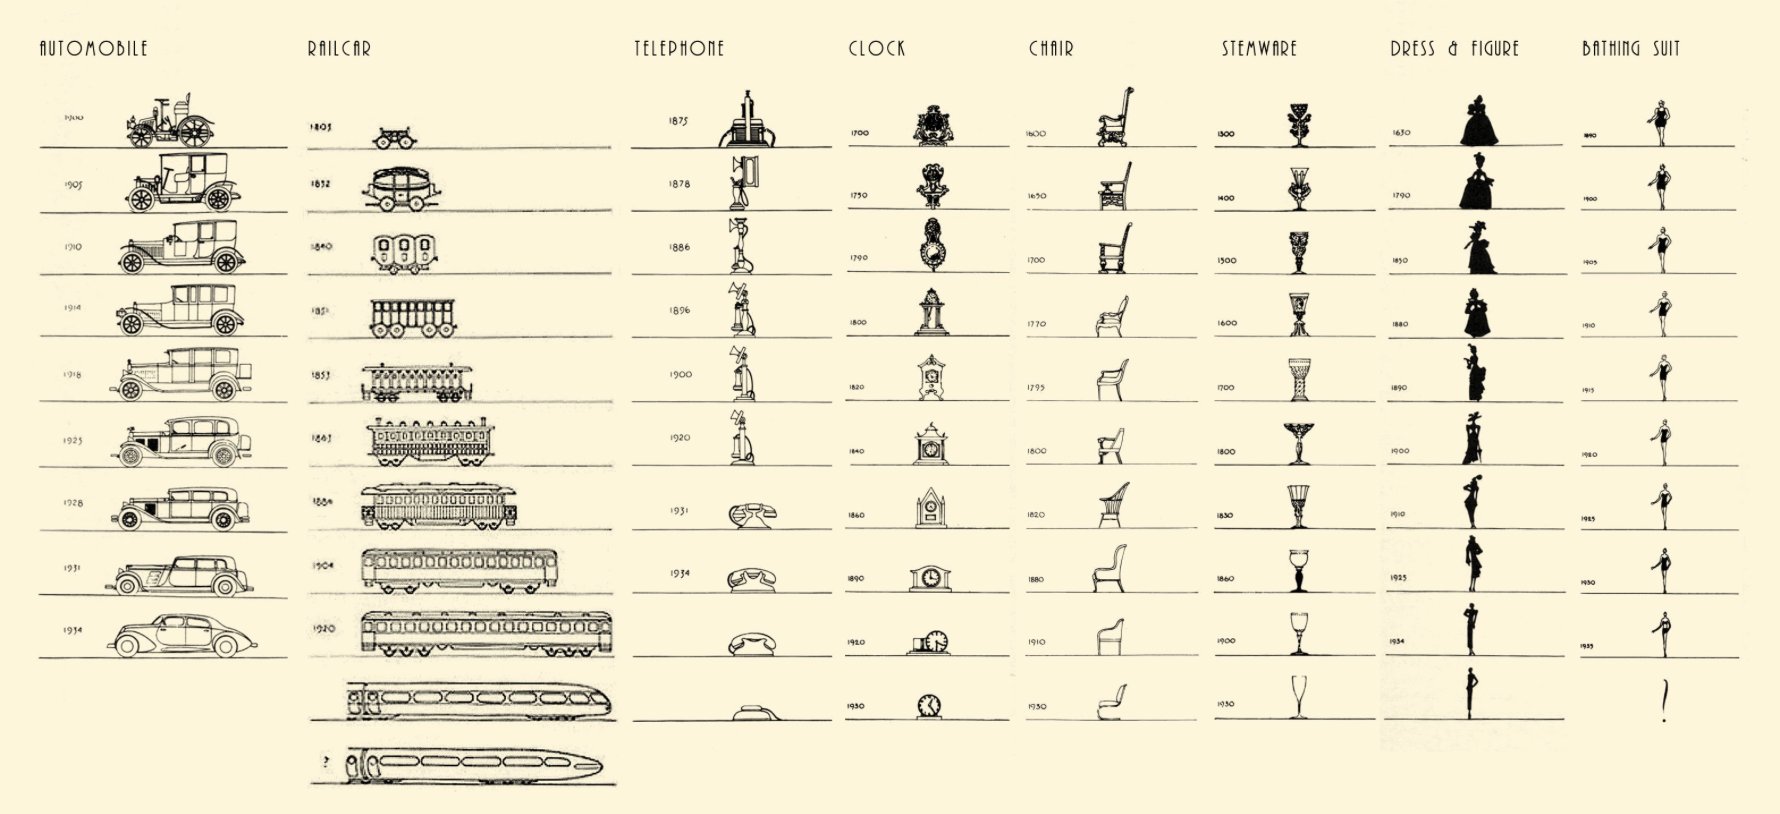
Vintage chart shows the evolution in design of everyday objects
May 31, 2018

By Raymond Loewy, this chart from 1934 shows the shifts in design of the car, telephone, and clock, among other things. I assume someone is already working on updating this one to the present. [via @michaelbierut]

Become a member. Support an independent site. Get extra visualization goodness.

See What You Get

Favorites

What Qualifies as Middle-Income in Each State

The meaning of “middle-income” changes a lot depending on where you live and your household size.

Best Data Visualization Projects of 2016

Here are my favorites for the year.

The Most Unisex Names in US History

Moving on from the most trendy names in US history, …

Finding the New Age, for Your Age

You’ve probably heard the lines about how “40 is the new 30” or “30 is the new 20.” What is this based on? I tried to solve the problem using life expectancy data. Your age is the new age.