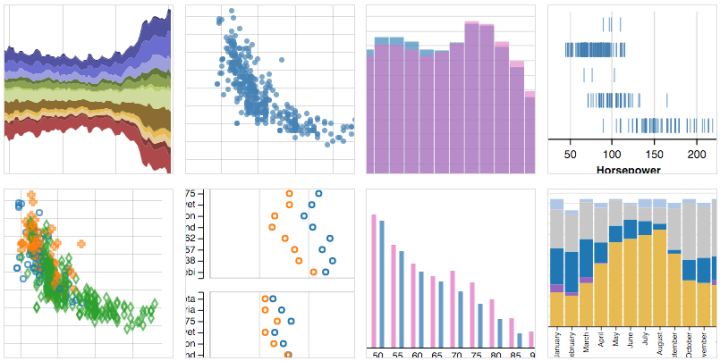
A few years ago, Trifacta released Vega, a “visualization grammar” that lets you create charts with a JSON file. But you still have to declare a lot of things to make something standard like a bar chart. Vega-Lite, recently released by the University Washington Interactive Data Lab, lets you take advantage of Vega but with much fewer specifications.
As you might have guessed, Vega-Lite is built on top of Vega, a visualization grammar built using D3. Vega and D3 provide a lot of flexibility for custom visualization designs; however, that power comes with a cost. With Vega or D3, a basic bar chart requires dozens of lines of code and specification of low-level components such as scales and axes. In contrast, Vega-Lite is a higher-level language that simplifies the creation of common charts. In Vega-Lite, a bar chart is simply an encoding with two fields.
That sounds good to me. Gonna give it a shot.


 Visualize This: The FlowingData Guide to Design, Visualization, and Statistics (2nd Edition)
