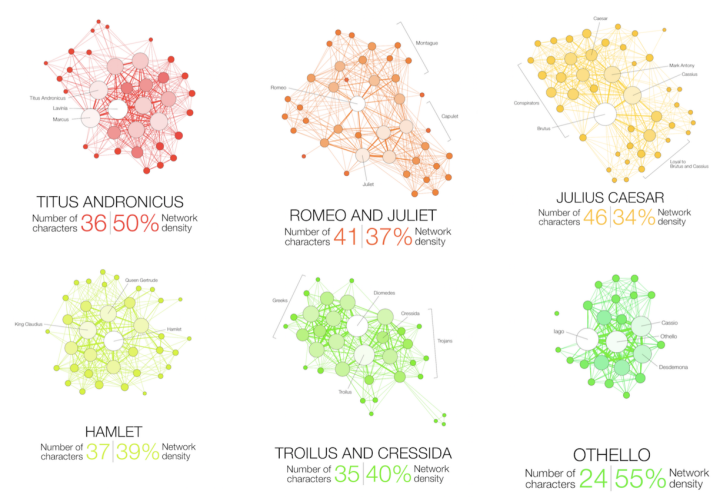
Martin Grandjean looked at the structure of Shakespeare tragedies through character interactions. Each circle (node) represents a character, and each connecting line (edge) represents two characters who appeared in the same scene.
[T]he longest tragedy (Hamlet) is not the most structurally complex and is less dense than King Lear, Titus Andronicus or Othello. Some plays reveal clearly the groups that shape the drama: Montague and Capulets in Romeo and Juliet, Trojans and Greeks in Troilus and Cressida, the triumvirs parties and Egyptians in Antony and Cleopatra, the Volscians and the Romans in Coriolanus or the conspirators in Julius Caesar.
At first glance, the eleven charts in total look hairball-ish. The above have similar network densities, which suggests similar story structures, but look at the ones that are more separated (lower network density) for contrast and then go from there.
Look a bit deeper? See also Understanding Shakespeare from a few years back, which visualized word usage and structure.

 Visualize This: The FlowingData Guide to Design, Visualization, and Statistics (2nd Edition)