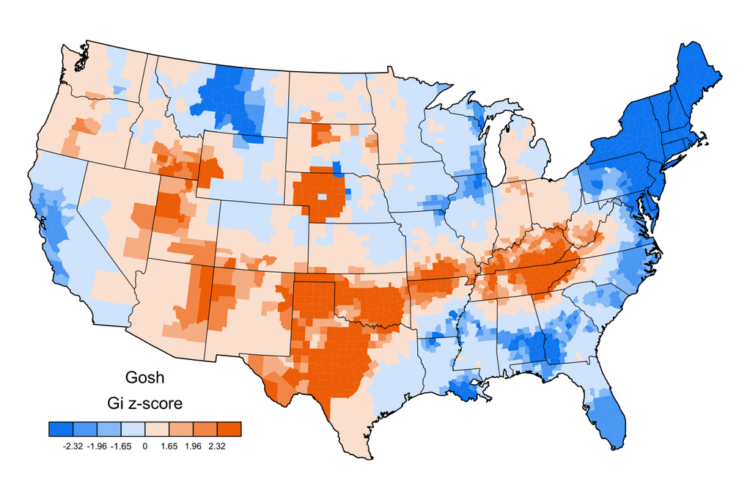
Linguist Jack Grieve posted a bunch of maps that show swearing geographically, based on geotagged tweets. Above is the map for “gosh”. The more red, the higher the relative usage in a county and the more blue, the less usage.
Here is the geographic distribution for “darn”, which has a strong showing in the midwest:

There are of course more four-letter words to look at, but I’ll leave that to you.
Keep in mind that being Twitter-based maps, this comes with the usual caveat that the distributions show the Twitter population’s language, which skews younger and more affluent than the general population. There’s also some smoothing and clustering going on here. It’s the same methodology Grieve used for previous maps that showed patterns for “bro”, “dude”, and “fella”.
 Visualize This: The FlowingData Guide to Design, Visualization, and Statistics (2nd Edition)