Where Bars Outnumber Grocery Stores

Back in 2008, the Floatingsheep group collected data about the number of bars across the United States, and they compared those counts against the number of grocery stores. Their map showed what they called the “beer belly of America”, which is a much higher than average number of bars in the Wisconsin area.
I came back to the map recently, and three questions came to mind:
- The original map only showed a binary comparison. That is, areas were either colored as more bars or more grocery stores. What if we mapped the magnitude of the difference?
- The data from 2008 comes from the now defunct Google Maps Directory and only represented references to bars and grocery stores (which maybe made the previous bullet point not worth doing then). Would using the newer Google Places API provide more detail?
- What about other countries?
I started with the first two questions and went from there.
Pulling data from the Places API, I reproduced the two-category map as a quick check. They look similar. Again, you see the “beer belly” in the Wisconsin area.
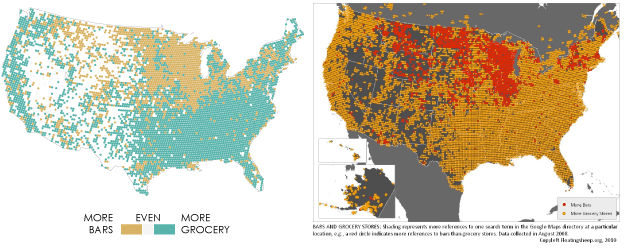
So the data appears to check out (more on this at the end). The nice thing about the Google Places API is that businesses are categorized and searchable, which makes it a lot easier to count given an area of the country. I chugged along every 20 miles and then searched within a 10-mile radius for bars and grocery stores. Then it was simple math to get the ratios.
The map below shows these ratios. The more bars, the darker the brown and the more grocery stores, the darker the green. It’s kind of what you’d expect, but now you can really see that high bar concentration in Wisconsin, whereas a lot of the country has at least three times more grocery stores.

From a per capita perspective, Wisconsin has the third highest rate with about 8 bars per 10,000 people. North Dakota and Montana take the one and two spots at 9.9 and 8.6 bars per 10,000 people, respectively. Delaware, Maryland, and Mississippi have the lowest rates, all with under 1.5 bars per 10,000 people.
I’ve actually been to none of these six states, so I’m not sure how to interpret these rates. The gut reaction is to assume that states with a lot of bars must drink a lot, relative to the others, but it might just mean that people like to hang out at bars in these areas. Maybe they don’t even drink. Maybe people in other states drink more at home.
So I’ll leave interpretation to the residents. I’m a Californian. My state has the fifth lowest rate, but I wouldn’t say people don’t drink by any stretch of the word.
On to the ratio in other countries. Click to see big.


One interesting bit is that when the original Floatingsheep map was going around, people commented that there was a significant Polish and German population in Wisconsin, which was a possible reason for the high number of bars. However, you can see that in most of both countries, grocery stores dominate.
Bars per 10,000 in Poland (1.0) and Germany (2.6) are also lower compared to the selected European countries (Spain at 3.9, United Kingdom at 3.9, Italy at 5.6, and France at 8.4).
Worth noting
Again, higher rates don’t necessarily point to higher volumes of drinking. You can look to drinking estimates from the World Health Organization or OECD for those comparisons. I think the bar versus grocery store comparison says more about culture than anything else. This is just a guess though.
It’s also worth noting again that this data comes from the Google Places API. These numbers aren’t from official government records, so we’re placing a lot of stock in that the data from Google is accurate. I suspect mileage varies across countries, but the results did seem to make sense for the countries that I’ve been to.
I also checked random locations manually in each country as a sanity check. Places classified as bars and grocery stores did seem to match up with their Google streetviews.
Finally, the per capita rates here are probably higher than you might get from government records, because places can have multiple place types. For example, a hotel with a bar or a restaurant with a bar can be counted as bars, which is different from places that solely serve liquor.
Become a member. Support an independent site. Make great charts.
See What You GetMy work on FlowingData is supported by paid memberships. Since 2007, I have been analyzing data and making charts to help people understand and appreciate data in their work and everyday lives. I hope to keep it going for many more years.
If you liked this (or want to learn how to make similar data things), please consider supporting this small corner of the internet with a membership. You get unlimited access to visualization courses, tutorials, and extra resources. Thanks. — Nathan
Chart Type Used
