Because Fox News. See also this, this, and this. [Thanks, Meron]
Fox News bar chart gets it wrong
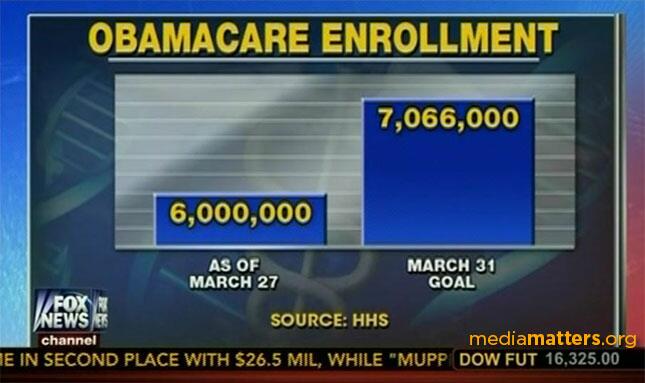
Chart Type Used

Second Edition
 Visualize This: The FlowingData Guide to Design, Visualization, and Statistics (2nd Edition)
 Visualize This: The FlowingData Guide to Design, Visualization, and Statistics (2nd Edition)
New tools, refined process.