Those who use the ggplot2 package in R and do everything else in Python will appreciate this Python port of the package from yhat.
Excel makes some great looking plots, but I wouldn’t be the first to say that creating charts in Excel involves a lot of manual work. Data is messy, and exploring it requires considerable effort to clean it up, transform it, and rearrange it from one format to another. R and Python make these tasks easier, allowing you to visually inspect data in several ways quickly and without tons of effort.
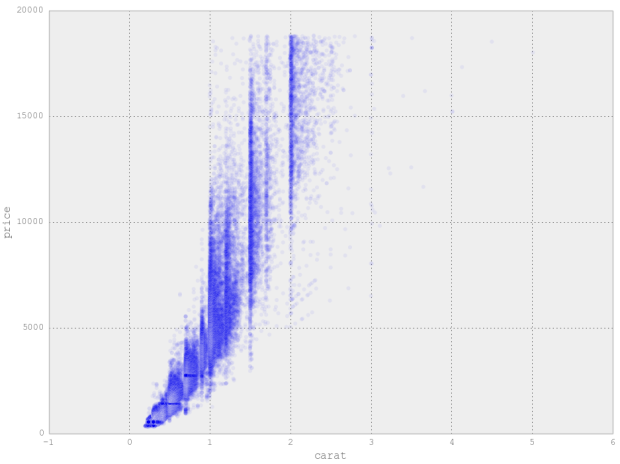
The preeminent graphics packages for R and Python are ggplot2 and matplotlib respectively. Both are feature-rich, well maintained, and highly capable. Now, I’ve always been a ggplot2 guy for graphics, but I’m a Python guy for everything else. As a result, I’m constantly toggling between the two languages which can become rather tedious.
Once you get the Python library installed (and its dependencies), you’ll be able to use the same layered graphics approach as the R package, with a similar syntax.
 Visualize This: The FlowingData Guide to Design, Visualization, and Statistics (2nd Edition)