Josh Stevens, a PhD candidate at Penn State, mapped 92 years of sasquatch sightings, based on data from the Bigfoot Field Researchers Organization. Before you furiously type that the map is just population density, Stevens addresses that.
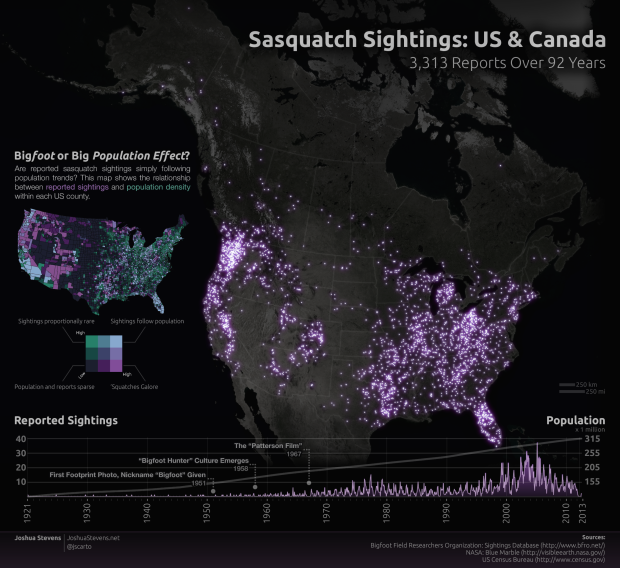
Right away you can see that sightings are not evenly distributed. At first glance, it looks a lot like a map of population distribution. After all, you would expect sightings to be the most frequent in areas where there are a lot of people. But a bivariate view of the data shows a very different story. There are distinct regions where sightings are incredibly common, despite a very sparse population. On the other hand, in some of the most densely populated areas sasquatch sightings are exceedingly rare.
The bivariate view he mentions is the county map on the left. Bright purple is high sasquatch sightings and low population density, and light green is high population density and relatively low sassquatch sightings. So it’s not all about population. More likely, it’s the vegetation level of the terrain, because as we all know, sasquatches prefer dense bushes and trees with grainy overtones.
 Visualize This: The FlowingData Guide to Design, Visualization, and Statistics (2nd Edition)