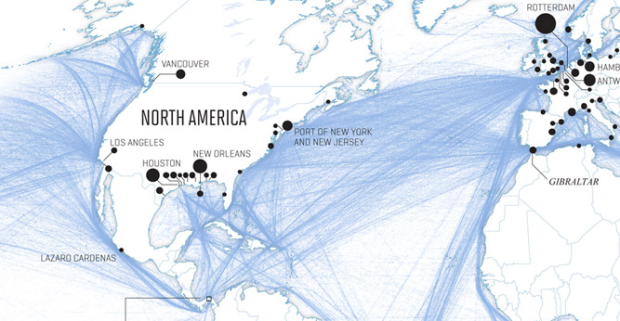
Nicolas Rapp dives into the patterns and growth of worldwide shipping in a six-page spread for Fortune Magazine.
Nearly 90% of all goods traded across borders travel, in part, by sea. Typically a ship will undertake six voyages a year. The fastest-growing routes are between ports in Asia, while goods moving out of that continent account for 43% of all maritime trade, according to IHS Global, an economic forecasting firm. Today the most heavily trafficked sea route is between China and the West Coast of the U.S. The total value of goods that travel from China to the U.S. is four times that of those on the return trip—a clear symbol of America’s trade deficit.
Despite a gap of a few centuries, the routes today still look a lot like the ones from the 18th century.
 Visualize This: The FlowingData Guide to Design, Visualization, and Statistics (2nd Edition)
Beautiful map. The link to the original source doesn’t seem to work though.
Try again? It works for me.
Works on the Mac at home but had an ‘address not found’ page on the PC at work… could be the network. Filters…
Thanks for the post. Love the map.
It’s always a shame when New Zealand is cropped from maps.
There are a lot of different ways to measure shipping traffic, including cargo volumes, ship movements, and container movements.
Would be interesting to see the latter in particular, since that’s what the accompanying article is most concerned with. This would make the Ports of LA and Long Beach look much larger than Houston and New Orleans.