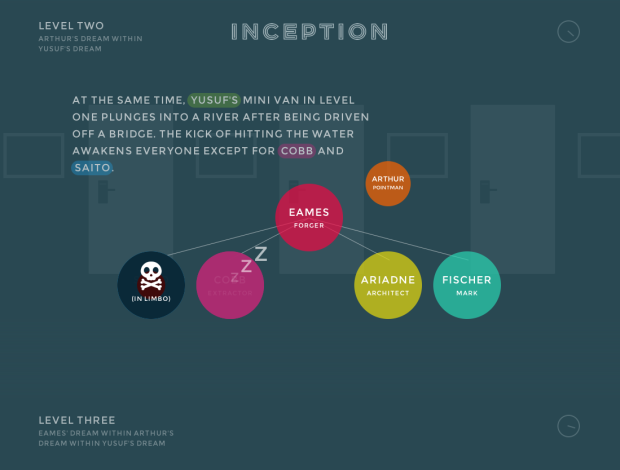
Designer Matt Dempsey explains the storyline of Inception in this fun experiment. There were a few flowcharts that came out when the movie did, including one from Christopher Nolan, but this one takes the cake. Just keep on scrolling down to move through levels, and people (the colored circles) disappear and reappear as people go in and out of dreams and limbo.
Inception Explained in Animated Infographic
Second Edition
 Visualize This: The FlowingData Guide to Design, Visualization, and Statistics (2nd Edition)
 Visualize This: The FlowingData Guide to Design, Visualization, and Statistics (2nd Edition)
New tools, refined process.