We often think of communities in the framework of government-set boundaries, but relationships can exist across states and counties. In a collaboration between researchers from AT&T Labs Research, IBM Research, and MIT SENSEable City Laboratory, these relationships are revealed through an analysis of SMS and call data.
Using millions of anonymized records of cell phone data, researchers were able to map the communities that people form themselves through personal interactions. The cell phone data included both calls and texts and was collected over a single month from residential and business users.
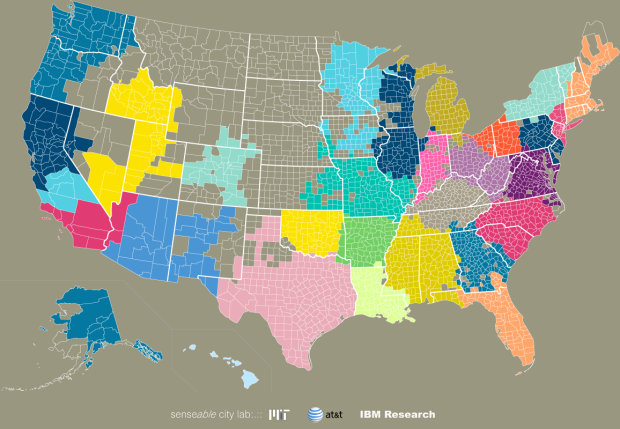
Researchers applied a modularity algorithm to cluster counties that messaged and called each other more often. The map above shows “communities” based on SMS, where each color represents a cluster. It’s not uncommon for relationships to stretch across state boundaries, such as those in Washington and Oregon or West Virginia and Ohio.
Below shows a different (sort of less useful) view of phone calls. The higher the arc, the more phone calls between two areas. The taller, skinnier arcs represent calls within a specific region.

And here are the same maps with some sexy music in the background.
Check out the AT&T Labs Research writeup for more insights into the data.
 Visualize This: The FlowingData Guide to Design, Visualization, and Statistics (2nd Edition)
It is interesting how state lines in the U.S., like former country borders in the old Yugoslavia and in colonial Africa, do not reflect social reality. The two locales I have experience with (Wisconsin and Indiana) make complete sense. Many in NW Indiana identify with Chicago and in NW Wisconsin you will find a heavy dose of Vikings fans (sacrilege!).
The Upper Midwest area also matches pretty closely with the map of North American dialects that was posted here a few months ago.
I don’t get it…in the first map above. what do the colors mean? …and I find it hard to believe some geographical areas have no access to SMS? I know they’re remotely populated.
Not surprisingly, parts of the first map align closely with Pearcy’s vision of the 38-state Nation.
Seems like they should have included a coverage map, that might explain why there are no connections in North and South Dakota, or Montana.
I was wondering about that too, especially since Vermont is just as rural as the Great Plains.
AT&T has minimal operations in the Mountain time zone, which probably explains the large grey section.
The URL senseable.mit.edu/csa suggests an unfortunate initialism–see the first entry at http://en.wikipedia.org/wiki/CSA
I thought Community Supported Argiculture, myself. I think the initals take a regional meaning, I happened to live near some hippies.
-The headline is for combined Call and SMS data, but the map used is SMS only.
-The differences between call regions and SMS regions are fascinating. Southern California has its own SMS region, but not a call region. Oklahoma and Arkansas are two SMS regions, but one call region. Louisiana, Mississippi, Alabama, and Georgia combine differently for SMS and calls. West Virginia combines with Ohio for SMS, but with western Pennsylvania for calls. I assume (on inadequate data) that these are age related. Anyone know more?
It’s crazy to think that all of this data was compiled in only a month. Any time raw data can be used to track something with the potential to be socially applicable is always fascinating!