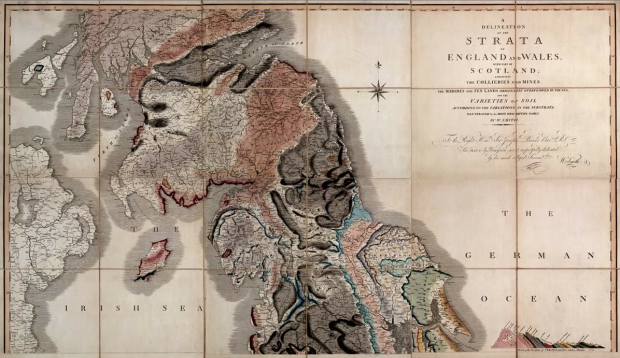
Shawn Allen of Stamen Design provides a brief history of data visualization, starting with William Playfair’s charts in the late 1700s and William Smith’s map sketch of Britain, up to the more recent works from The New York Times, Martin Wattenberg, and Ben Fry.
This leads into a description of what data is, from a practical point of view, as the writeup is actually an introduction for Allen’s visualisation course at the School of Visual Arts. Totally looks like a course I wish I could’ve taken in grad school.
 Visualize This: The FlowingData Guide to Design, Visualization, and Statistics (2nd Edition)
Cool. I realise I’ve always been working in data visualisation since my geology degree – it’s what geologists do.
Love the Napoleonic map – though I have seen it before, it is brilliant.
That’s why I found strategy consulting so easy!
Just one, picky, point with the article – ‘data’ is a plural word…!
The New York Times uses ‘data’ as singular and plural, ergo singular is fine:
http://en.wikipedia.org/wiki/Data#Usage_in_English
have you seen http://datavis.ca/milestones/ ? quite impressive
The Milestones in the History of Thematic Cartography, Statistical Graphics, and Data Visualization site that sb linked to is indeed brilliant.
The previous version of the site had some downloadable PDF articles, which are interesting.
Pingback: A brief history of visualization | Risk Predictions
Pingback: Oh, the Humanities | Trends In Ed
Pingback: Data Visualization « Ed