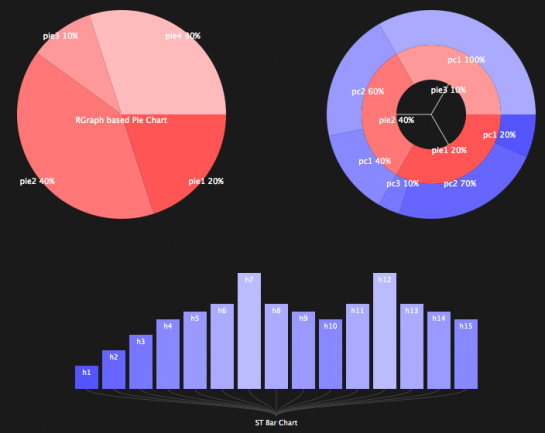
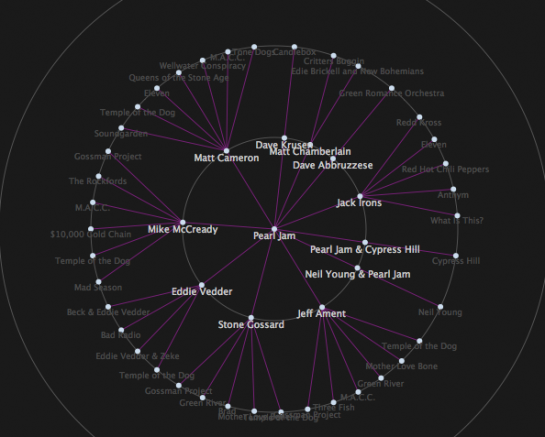
As we’ve seen, javascript is growing into a viable solution for visualization on the Web. John Resig ported Processing to javascript about a year ago and we saw some projects in javascript to show off speed in Google Chrome.
Most recently, Nicolas Garcia Belmonte released version 1.1 of his InfoVis Toolkit, which provides a basic set of tools for creating interactive visualizations on the Web. Some of the features:
- Multiple Data Representations – Treemaps, Radial Layouts, HyperTrees/Graphs, SpaceTree-like Layouts, and more…
- Major Browsers Support – IE6+, Firefox2+, Safari3+, Opera9.5+
- Open Source – Licensed under the BSD License
- Library Agnostic – You may use the JIT with your favorite DOM manipulation framework
- Extensible – All visualization classes are mutable, so you can easily add/override any method you want.
- Composable – Visualizations can be combined in order to create new visualization methods.
Here are a couple of things you can do with the toolkit:


Visit the site for more demos.


Pingback: Daily Research » Shared Items - June 6, 2009