Energy consumption grows more and more concern, and with the popularity of Mr. Gore’s An Inconvenient Truth, just about everyone is at the very least, semi-aware of energy consumption. These 21 visualizations and designs were created to increase that awareness, so that maybe, a few more people will turn off the light when they leave a room. I think Peter Crabb said it best (which I borrowed from Tiffany Holmes’ ecoviz paper):
[P]eople do not use energy; they use devices and products. How devices and products are designed determines how we use them, which in turn determines rates of energy depletion.
Here they are – 21 dashboards, ambient devices, games, and calculators.
Environmental Dashboards
The growing availability of energy data has lent itself nicely to dashboards that let viewers keep track of how much energy is consumed at any given time. They are perpetuated by the idea of living buildings and devices.
7,000 Oaks
Using the tree metaphor to mentally link energy consumption to the physical world.
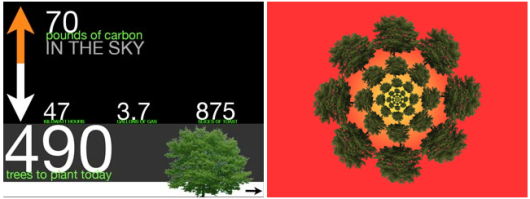
Energy Literacy
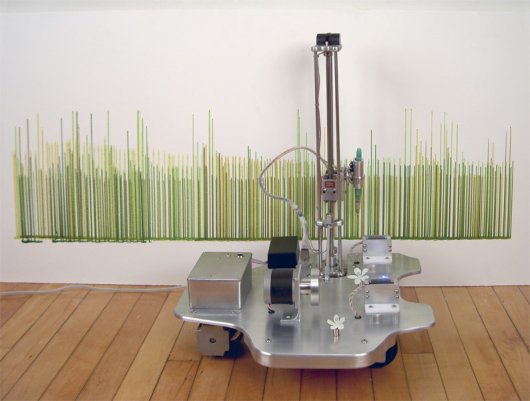
Energy Tree
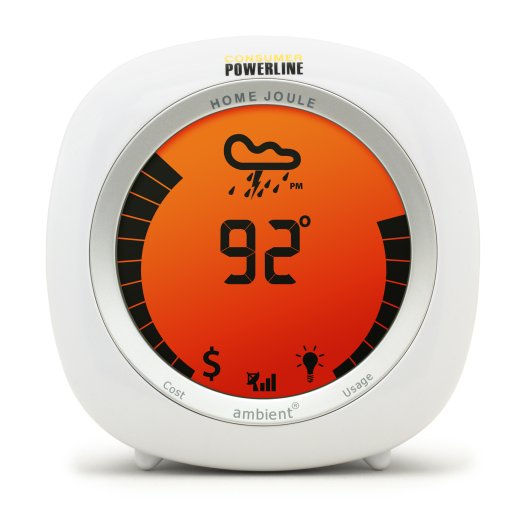
Energy Joule
Another one from ambient devices.
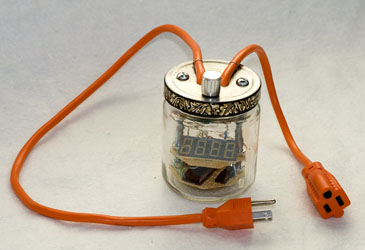
Enerjar
Oh yeah, definitely going to be hooked up to every computer in 10 years…
Mapping Energy
We’re trying to save the world right? We better map it. Here’s what the world looks like in terms of energy consumption.
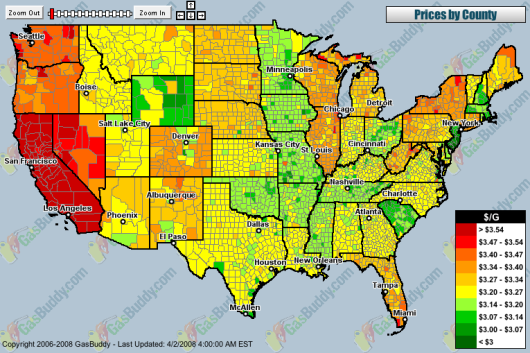
Gas Temperature
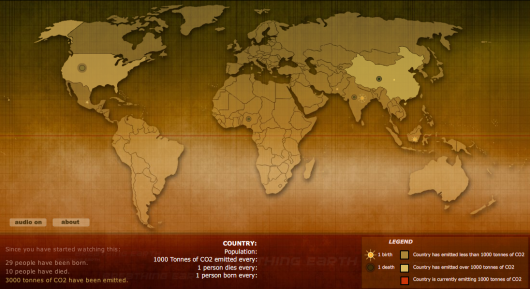
Breathing Earth
I posted about this one a little while back – based on carbon dioxide emission rates.
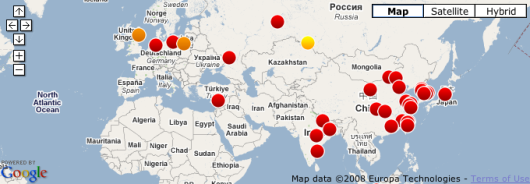
Carbon Monitoring for Action (CARMA)
You knew this was coming. Another Google maps mashup.
Carbon Tracker
![]()
Ambient Visualization
Energy consumption can serve as awareness decoration too. These devices serve as pretty things on your desk while creating energy awareness.
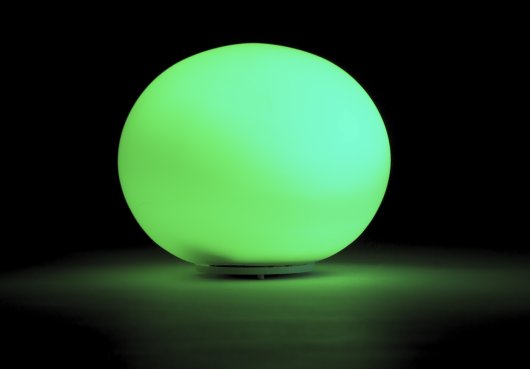
Ambient Orb
It glows and changes color according to the amount of electricity in use.
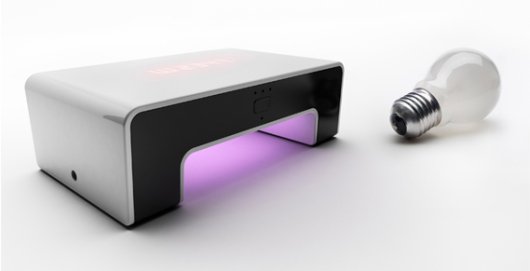
Wattson
It’s similar to the ambient orb, but it shows a number that comes from your meter in the basement.
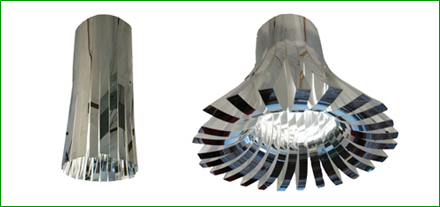
Flower Lamp
Watch the lamp flourish and close up, dependent on how much energy you’re consuming.
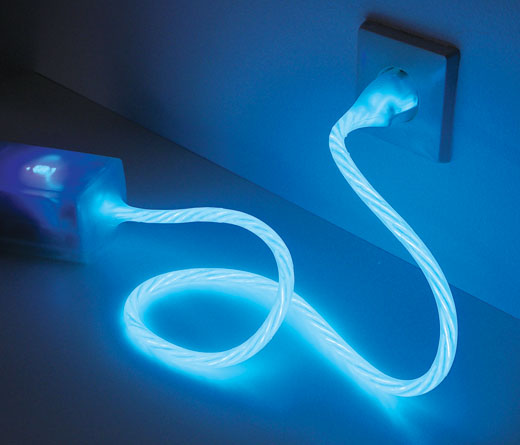
Power Cord
Pretty glow. Glow. Mesmerized.
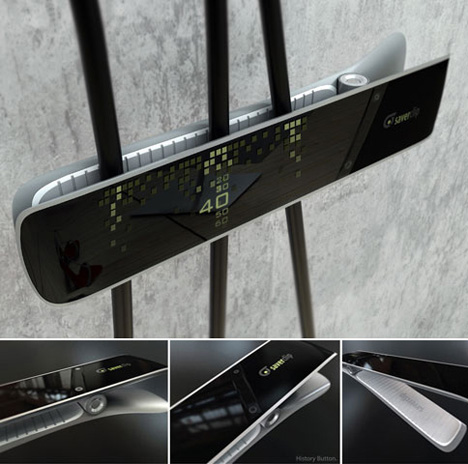
Saver Clip
Hook up the clip to a power cord and watch the fluctuations.
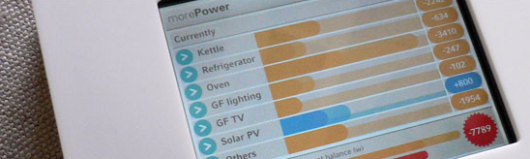
Statistical Graphics
Bar charts are easy to understand.
Vampire Energy
I vant to suck your energy. I mean vlood.
Real Costs
This is interesting. It’s a Firefox plugin that overlays charts showing “real cost” in terms of energy for stuff like flights and train rides.
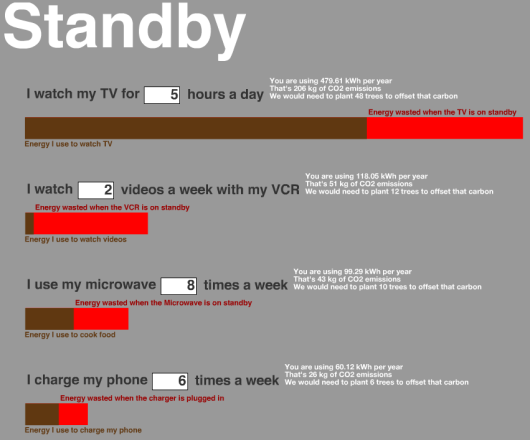
Standby
Energy calculator, and before you ask, no, I don’t watch 5 hours of tv per day. I watch 10.
Miscellaneous
These don’t fit into any category really, but are interesting nevertheless.
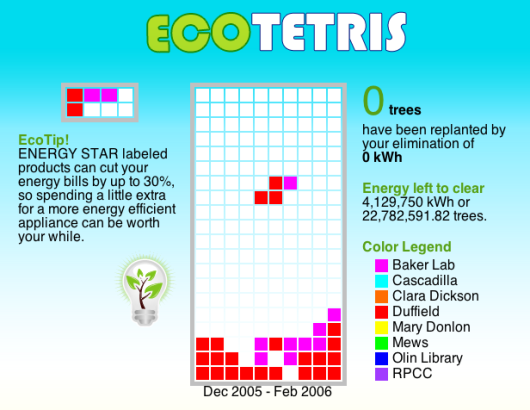
EcoTetris
A variation of the greatest game ever.
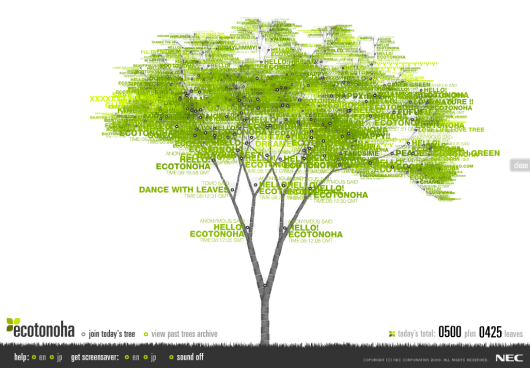
Eco Tonoha
Get NEC to plant more trees by building virtual ones.
Electronic6
Black Balloon Campaign
Black balloons represent green house gas produced whenever you use energy. I have the power to make a difference. So do you.
 Visualize This: The FlowingData Guide to Design, Visualization, and Statistics (2nd Edition)
Also a very nice infovis about the water usage for specific products http://www.traumkrieger.de/virtualwater/
@steffen: i had that one in my queue too, but decided to save it for a rainy day i.e. water conservation post.
@nathan: sorry for that – and excited for the post
Pingback: Nature Trademarked » Do Visualizations Help Bring Environmental Change?
We have a big exhibition about this subject! (the Netherlands)
See for further details: http://www.tag004.nl
Cheers for posting the EnergyTree. You can also see it at Tags exhibition.
@Ben: no problem. it looks like a really cool (and useful) monitoring device.
I am really interested in this stuff – helping people internalize data to influence their energy decisions on a conscious, or even more instinctual, level. Watt Watchers is my contribution:
http://coloured.net/john/portfolio/energyawareness/
http://www.core77.com/competitions/greenergadgets/projects/4625/
The CARMA site now provides a number of widgets that people can embed on social network sites to help raise awareness, encourage interaction, and spread the data – http://carma.org/widgets/. Finally, all the data is freely available and can also be re-used on other web applications via our API – http://carma.org/api/