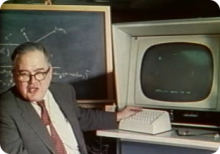
 With the start of a new year, it only seems right to open with John Tukey and his work with interactive graphics. In 1972, when computers were giant and screens were green, John Tukey came up with PRIM-9, the first program to use interactive dynamic graphics to explore multivariate data. PRIM-9 allowed picturing, rotation, isolation, and masking. In other words, PRIM-9 allowed users to see multivariate data from different angles and identify structures in a dataset that might otherwise have gone undiscovered (kind of like the more recent GGobi).
To fully appreciate the revolutionary nature of PRIM-9 one has to view it against the backdrop of its time. When Statistics was widely taken to be synonymous with inference and hypotheses testing, PRIM-9 was a purely descriptive instrument designed for data exploration. When statistics research meant research in statistical theory, employing the tools of mathematics, the research content of PRIM-9 was in the area of computer-human interfaces, drawing on tools from computer science. When the product of statistical research was theorems published in journals, PRIM-9 was a program documented in a movie.
John W. Tukey’s Work on Interactive Graphics. The Annals of Statistics, Vol. 30 No. 6. 2002.
Luckily, you can appreciate Tukey’s work here at the ASA video library. It’s even more amazing when you consider where computers and technology were at back then. Who knows where Statistics would be if it weren’t for Tukey and his brilliance and creativity. I can’t imagine, or maybe I just don’t want to.
Tukey was someone who truly understood data — structure, patterns, and what to look for — and because of that, he was able to create something amazing.
 Visualize This: The FlowingData Guide to Design, Visualization, and Statistics (2nd Edition)
Nice post… and my manual trackback.
That is an astonishing video. Thank you for pointing it out! This system anticipates the next 25 years of work in visualization. (To give one example, Spotfire seems just a footnote to PRIM-9). And Tukey’s summary at the end shows that he learned lessons about the importance of UI and iterative development that it took everyone else decades to figure out.
Thank you VERY VERY much for this fantastic Video. I am a french Engineer trying to teach concepts of Statistics by means of EDA with interactive Graphics, and to promote Tukey’s Ideas in Data Analysis.
This video will help me for this promotion.