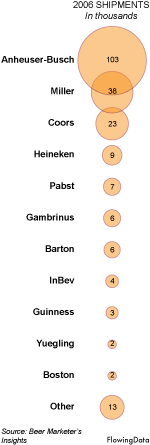
 Anheuser-Busch (Budweiser), Miller, and Coors lead the way in beer. Albeit, this is shipment data, not sales data, so take the numbers with a grain of salt.
The extreme dominance of the top three American beers was somewhat surprising to me, because I never see people order any of those three at restaurants. However, I gave it a few more seconds of thought. I’m thinking parties, sporting events, and drunken nights. The American beers go down easier (because they’re like water), so it’s easier to get drunk. To get drunk, people drink more. So I guess the watery dominance isn’t that surprising. I guess when people buy beer for taste at restaurants, they look to different brands.
Anyhow, I’m really starting to become a fan of these bubble charts. They’re really easy to read and can quickly spruce up a hard-to-read table of numbers. They also seem to scale decently. By well, I don’t mean in like the thousands, but in the tens, I think the bubbles can hold their own.
What kind of beer do you prefer?
 Visualize This: The FlowingData Guide to Design, Visualization, and Statistics (2nd Edition)
Not too sure if I like the bubble charts. The problem with that one is that if you just glance at the top two bubbles, it looks the the top one is about twice as large as the second one. When in fact the number is three times as large (about). I think humans have a problem comparing the relative sizes of areas versus the length of lines – I read that somewhere, where escapes me atm.
Pingback: Bars as an Alternative to Bubble Charts