Weather Underground is a useful site and a fun place for weather enthusiasts. WU has a bunch of weather data (current and historical) from established weather stations, like at airports, and home stations setup by hobbyists. One problem: most of the data is in HTML tables instead of the CSV format that we like. I say most because you can download hourly data from a single day in CSV, but if you want say, temperature data over the past 5 years, you’re kind of at a loss.
But wait, there’s a solution. That solution is BeautifulSoup, an XML/HTML parser written in Python. Um, parse… what does that mean? Basically, the Python script will go through, or look at, a document extracting certain information from that document.
Back to WU. Like I said, there’s historical data in HTML tables like this. I just want the actual mean temperature in Fahrenheit for the past five years or so. I could go to every single page manually and record the temperature in Excel, but why do that when I can make the computer do it for me?
I’m not going to get into all of the details, but here’s the Python script I used to grab mean temperature from WU using BeautifulSoup.
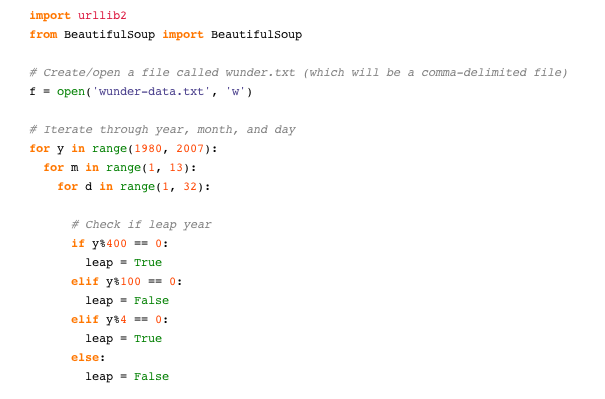
import urllib2
from BeautifulSoup import BeautifulSoup

# Create/open a file called wunder.txt (which will be a comma-delimited file)
f = open('wunder-data.txt', 'w')

# Iterate through year, month, and day
for y in range(1980, 2007):
  for m in range(1, 13):
    for d in range(1, 32):

      # Check if leap year
      if y%400 == 0:
        leap = True
      elif y%100 == 0:
        leap = False
      elif y%4 == 0:
        leap = True
      else:
        leap = False

      # Check if already gone through month
      if (m == 2 and leap and d > 29):
        continue
      elif (m == 2 and d > 28):
        continue
      elif (m in [4, 6, 9, 10] and d > 30):
        continue

      # Open wunderground.com url
      url = "http://www.wunderground.com/history/airport/KBUF/"+str(y)+ "/" + str(m) + "/" + str(d) + "/DailyHistory.html"
      page = urllib2.urlopen(url)

      # Get temperature from page
      soup = BeautifulSoup(page)
      dayTemp = soup.body.nobr.b.string

      # Format month for timestamp
      if len(str(m)) < 2:
        mStamp = '0' + str(m)
      else:
        mStamp = str(m)

      # Format day for timestamp
      if len(str(d)) < 2:
        dStamp = '0' + str(d)
      else:
        dStamp = str(d)

      # Build timestamp
      timestamp = str(y) + mStamp + dStamp

      # Write timestamp and temperature to file
      f.write(timestamp + ',' + dayTemp + '\n')

# Done getting data! Close file.
f.close()
The script goes through each day of the year from 1980 through 2007, parses the corresponding WU page, and stores the temperature data in wunder-data.txt, and there you go. Keep in mind, this was really just a proof of concept, and the script can be modified quite a bit to fit your needs.
The Main Point
Just because data isn’t in CSV format, doesn’t mean it’s unavailable. If it’s on the Web, it’s up for grabs.
 Visualize This: The FlowingData Guide to Design, Visualization, and Statistics (2nd Edition)
Pingback: Flowing Data / Finding Weirdness in Temperature Data
This is exactly what I needed. Thank you!
Pingback: Spatial Data « Flirting with Data