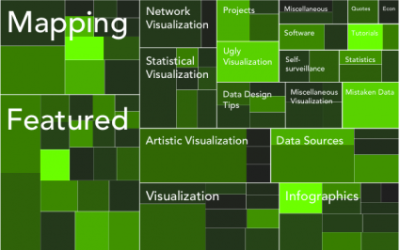
Treemap
It shows the individual values as they compare to the whole. Rectangles are arranged to maintain hierarchy.
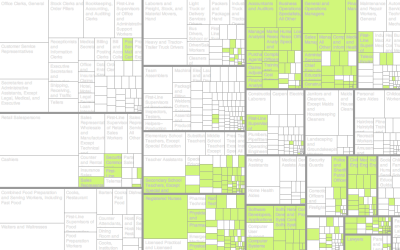
Jobs Charted by State and Salary
Jobs and pay can vary a lot depending on where you live, based on 2013 data from the Bureau of Labor Statistics. Here's an interactive to look.
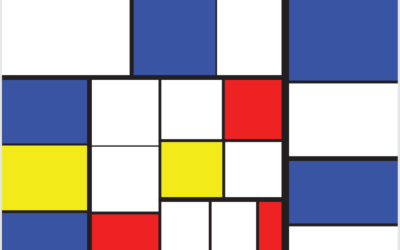
Treemap art
Ben Shneiderman invented the treemap in the 1990s to visualize the hierarchical contents…
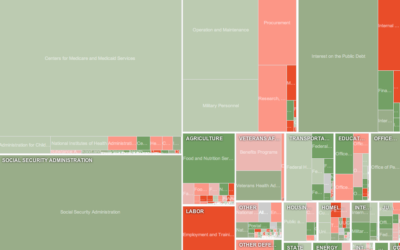
Exploratory treemap for Obama’s 2012 budget proposal
It’s that time of year again. Obama recently released his 2012 budget proposal…

Watching the Pulse of the Olympics on Twitter
The Olympics are in full swing, so of course Twitter is abuzz with…
An Easy Way to Make a Treemap
If your data is a hierarchy, a treemap is a good way to show all the values at once and keep the structure in the visual. This is a quick way to make a treemap in R.