Visualization
Showing the stories in data through statistics, design, aesthetics, and code.
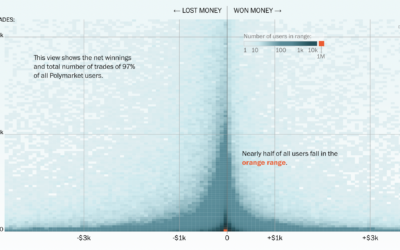
More people losing money in prediction markets
For the Washington Post, Jeremy B. Merrill and Leslie Shapiro visualized users who…
Rising prices at the grocery store
The U.S. Bureau of Labor Statistics published cost estimates for April 2026. If…
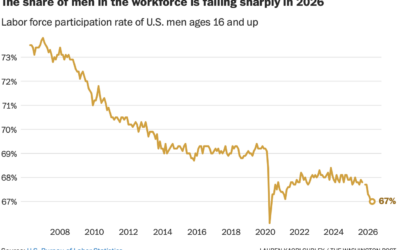
Men leaving the workforce
The percentage of U.S. men in the workforce has been declining for decades,…
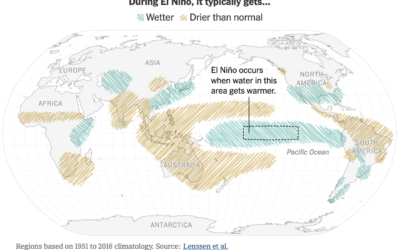

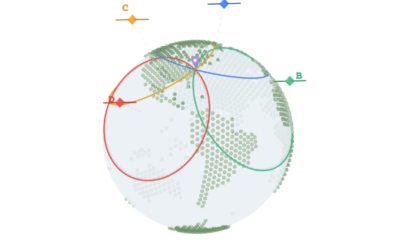
Getting oil to the gas tank from the Strait of Hormuz
For the New York Times, Agnes Chang and Pablo Robles illustrate the journey…

Visualizing history within a grid
For the Public Domain Review, Hunter Dukes and Adam Green visit Antoni Jażwiński’s…
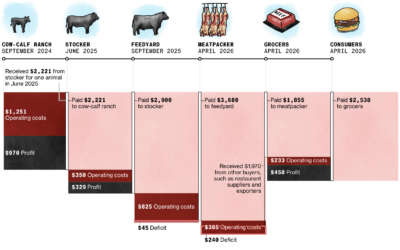
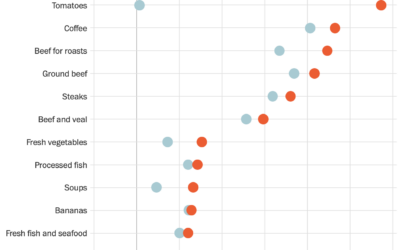
Increasing costs in the beef supply chain
Beef prices keep going up a noticeable amount in grocery stores. For Bloomberg,…

Cartographers review movie maps
John Nelson and Peter Atwood review maps that appeared in movies, such as…
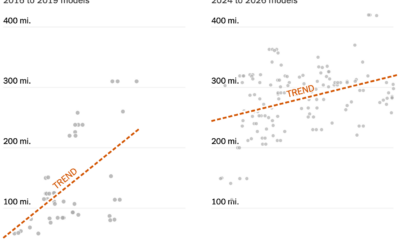
EVs getting cheaper to go farther
The cost of an electrical vehicle used to increase quickly as you shopped…
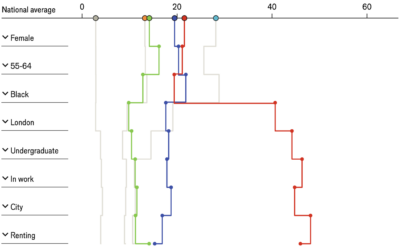
Build a British voter
The Economist shows probabilities that a person votes for each party, given a…
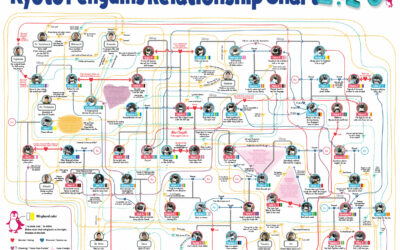
Penguin relationship diagrams at the aquarium
The Kyoto Aquarium in Kyoto and the Sumida Aquarium in Tokyo each have…
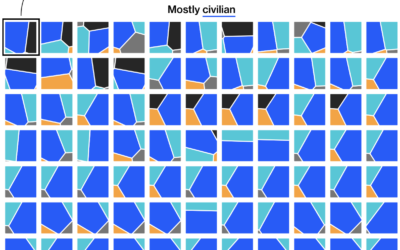
Estimating damage to civilian areas in Iran
Even if only military areas are targeted, civilian and commercial structures are also…
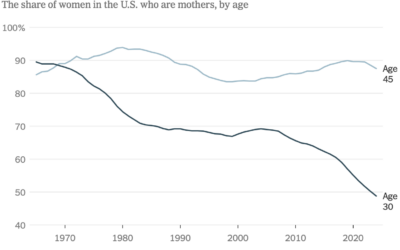
Lower fertility, probably delayed
Lower fertility is typically pitched as a bad thing, but it can be…
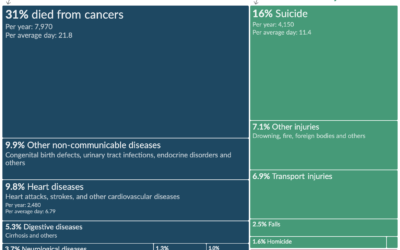
Causes of death around the world for different groups
Mortality varies widely by geography and demographic group. It has also changed over…
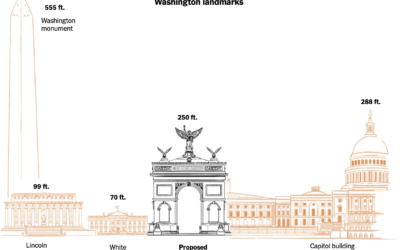
Scale of proposed arch in D.C.
The administration wants to build a 250-foot tall arch in Washington. That’s a…

Crackdown on democracy in Hong Kong
Millions of people protested in Hong Kong against China’s Communist Party back in…