Visualization
Showing the stories in data through statistics, design, aesthetics, and code.
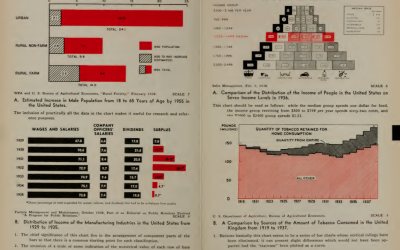
Classic 1939 book on graphs in its entirety
Willard Cope Brinton is credited as one of the pioneers of information visualization,…
Interactive explanation for how neurons work
Nicky Case made an interactive explanation of how neurons work. It’s part narrated…
Gravity visualized in physics demo
Properties of time and space using marbles and two large pieces of spandex sewn together in a classroom demonstration.
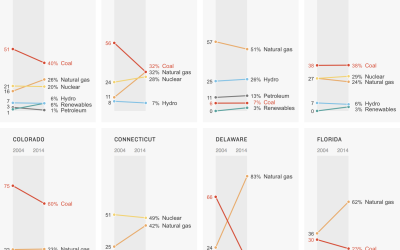
Power sources in each state
A clean and simple set of slope charts to show the change between 2000 and 2014.
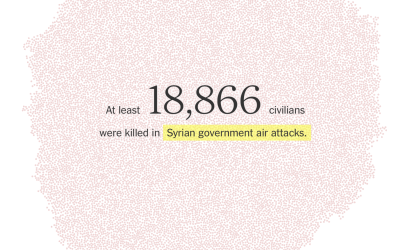
Death in Syria counted
In a striking representation by the New York Times, a dot represents each life lost.
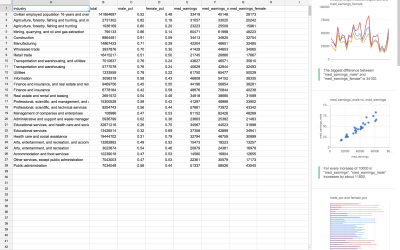
Automatic charts and insights in Google Sheets
So you have your data neat and tidy in a single spreadsheet, and…
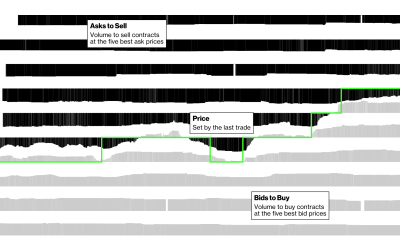
Searching for stock market spoofers
A stepper from Bloomberg that explains how spoofers put in fake orders to game the market.
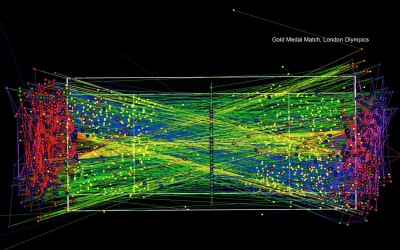
Maps to understand tennis
Damien Saunder, a cartographer at ESRI, likes to use mapping methods to evaluate…
Mike Bostock AMA →
The creator of d3.js is answering questions on reddit right now. Saving for…
Weevmee: Your Instagram photos turned artistic images
Weevmee autogenrates a woven-like image, based on your Instagram photos.
A lot of…
Be a tennis line judge: Interactive tests your skills
Watch video clips from the judge's point of view and try to make the call.
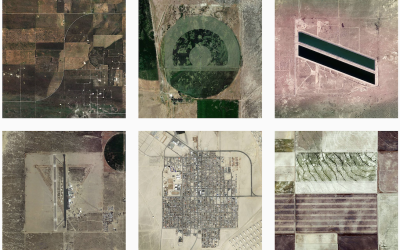
Square mile grid-ness of the United States
Named after the grid system Thomas Jefferson used to apportion land acquired through…

