Visualization
Showing the stories in data through statistics, design, aesthetics, and code.

Particles swirling in the atmosphere
Gavin Schmidt shows different types of particles that swirl around in our atmosphere:…
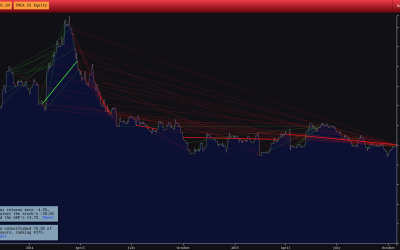
Stock trading game
Bloomberg Business has an interesting stock trading game with a simple premise. A…
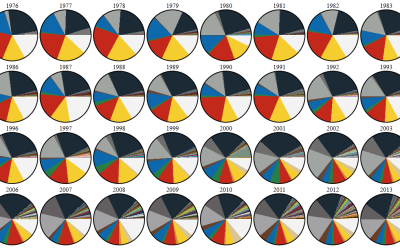
Evolving LEGO color palette
DaveE from the Brickset Forum was curious about the changing LEGO color palette,…
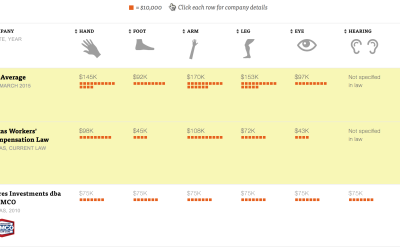
Value of body parts for injured workers
A detailed look at the state where companies can write their own workers' compensation plans.
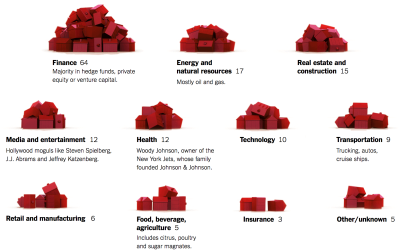
Monopoly pieces to show presidential funding
According to the New York Times, 158 families funded about half of the…
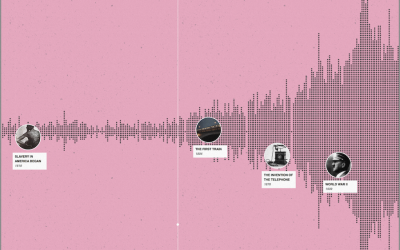
A timeline of history
“I wish there was a timeline browser for all the historical events documented…

Network Effect overwhelms with data
Network Effect by Jonathan Harris and Greg Hochmuth is a gathering of the…
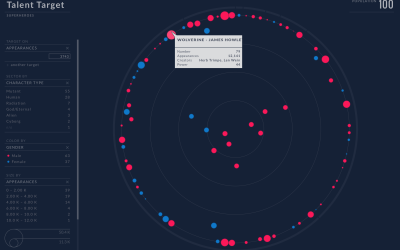
Superhero HR dashboard
Talent Lab is an application for human resource professionals to evaluate a work…
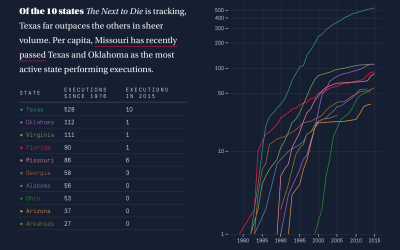
Human side of executions
On one side, a person is scheduled to die. On the other, the person did horrible things. It's complex.
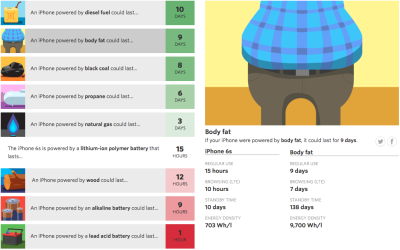
Imagining alternative iPhone power sources
Lithium-ion batteries power the iPhone (among other things), but what if we could…

London Underground rent map
In a straightforward map, Jason Allen for Thrillist replaced station names on the…

Scale model of the Solar System
In most depictions of the Solar System, planets are drawn big enough to…

Fun in exchange for personal data
Sensible Data by Martin Hertig is an installation that asks what personal data…
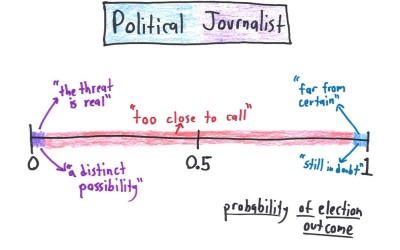
What probability means in different fields
Statistically, probability ranges from 0 to 1 — impossible to definitely without a…
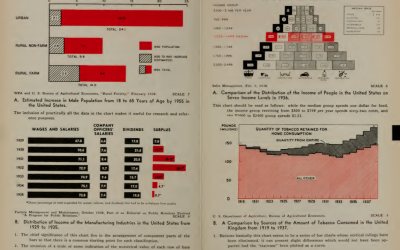
Classic 1939 book on graphs in its entirety
Willard Cope Brinton is credited as one of the pioneers of information visualization,…

Interactive explanation for how neurons work
Nicky Case made an interactive explanation of how neurons work. It’s part narrated…