
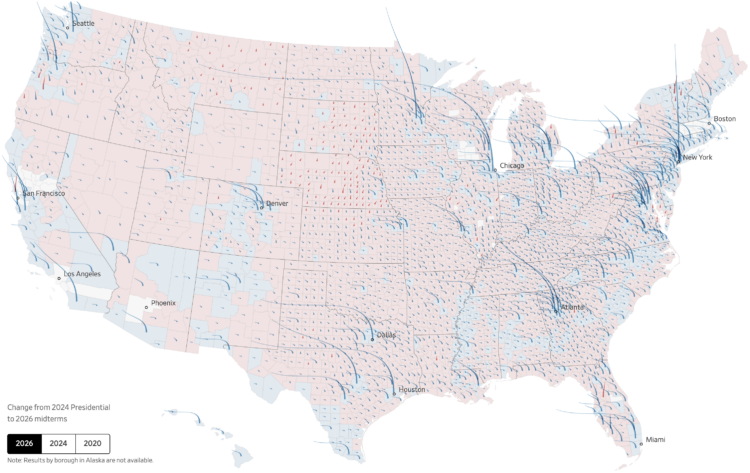
You’ve seen maps of the results and maps of the shifts. For the Wall Street Journal, Chiqui Esteban and Anthony DeBarros combined results and shifts into a single map using an interesting aesthetic that looks like strands of hair sprouting off the United States.
The base map shows county-by-county results for the predominant party between Democrat and Republican. The hair strands start as spikes pointing straight up, as we’ve grown used to over the years. The height of a spike represents the margin of victory versus the opposing party.
Scroll to the next step. The spikes bend to represent the swing, in comparison to the previous election, like strands of hair that blow in the wind. A deeper bend represents a greater swing for the county.
There’s a lot going on but it works. I approve of this hairy metaphor.
 Visualize This: The FlowingData Guide to Design, Visualization, and Statistics (2nd Edition)
