
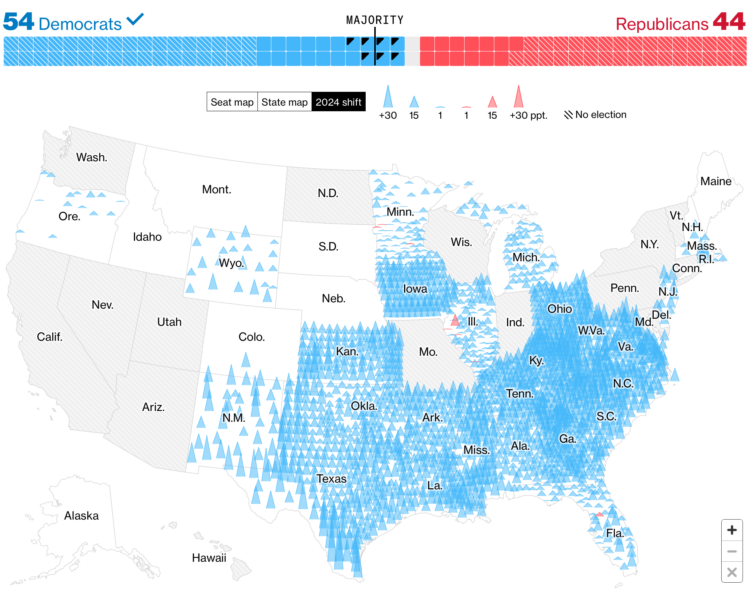
Bloomberg used mountain peaks to show the shifts towards Democrats and Republicans. Taller peaks represent greater shifts, and blue and red indicate Democratic and Republican shifts, respectively.
I prefer this map to the NYT map that uses arrows. It’s easier to spot the handful of Republican shifts without zooming in. The transparency helps too.
 Visualize This: The FlowingData Guide to Design, Visualization, and Statistics (2nd Edition)
