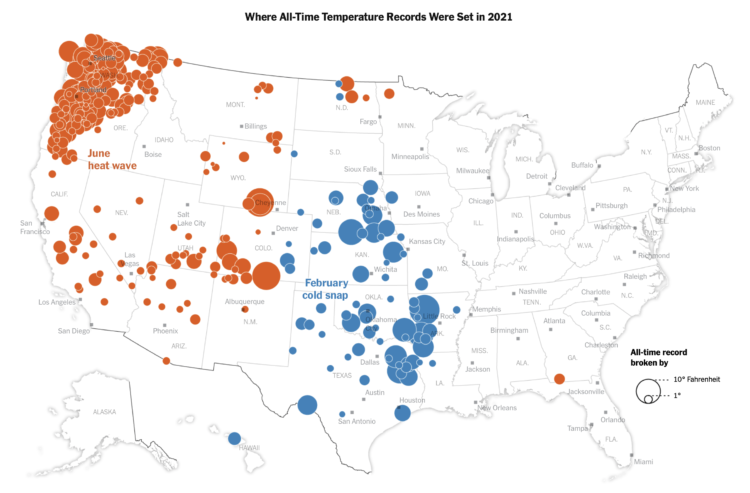
Using data from NOAA, Krishna Karra and Tim Wallace for The New York Times mapped all-time temperature records set in 2021. Red indicates an all-time high, and blue indicates an all-time low. Circle size represents the degree difference from the previous record.
All-time temperature records broken in 2021


 Visualize This: The FlowingData Guide to Design, Visualization, and Statistics (2nd Edition)
