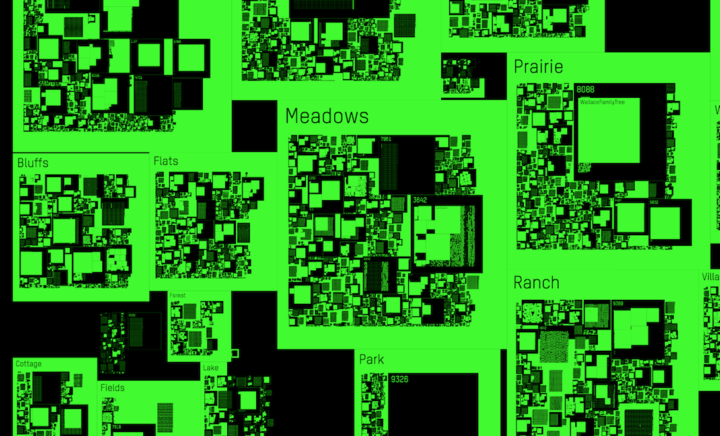
Geocities was a place on the web you could create your own space of blinking lights and MIDI tunes. There were millions of spaces modeled after a city. In an update to his 2011 piece, Richard Vijgen visualized the 2009 backup as a digital map.
This website is an interactive visualisation of the 650 gigabyte Geocities backup made by the Archive Team on October 27, 2009. It depicts the file system as a city map, spatially arranging the different neighbourhoods and individual lots based on the number of files they contain. In full view, the map is a data-visualisation showing the relative sizes of the different neighbourhoods. While zooming in, more and more detail becomes visible, eventually showing individual html pages and the images they contain.
Does it make me an old coot for liking the Geocities days better than the social media ones we’re in now? [via Waxy]


 Visualize This: The FlowingData Guide to Design, Visualization, and Statistics (2nd Edition)
