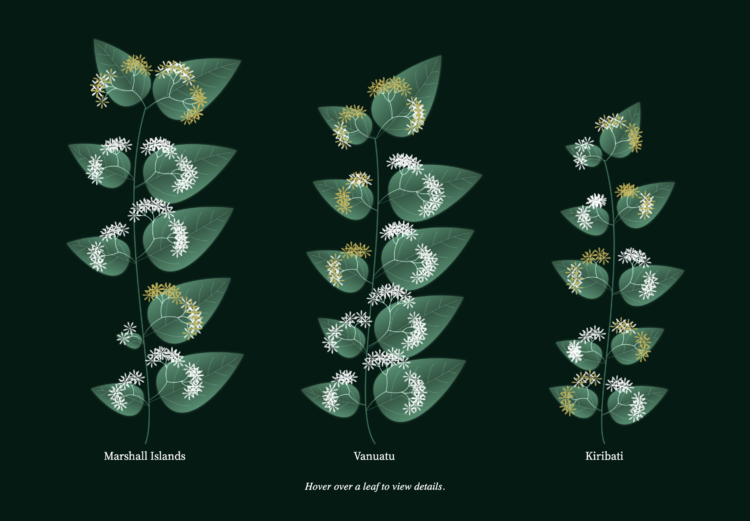
To show poverty in the Pacific Region between age groups, gender, and location, Kristin Baumann used a plant metaphor. Each element on the interactive represents an attribute. As a whole, the better the plant grows for a country, the lower the poverty.
Pretty.
The project was centered around a Pacific data challenge, but it’d interesting to see a whole bunch of plants for a lot more countries.
 Visualize This: The FlowingData Guide to Design, Visualization, and Statistics (2nd Edition)