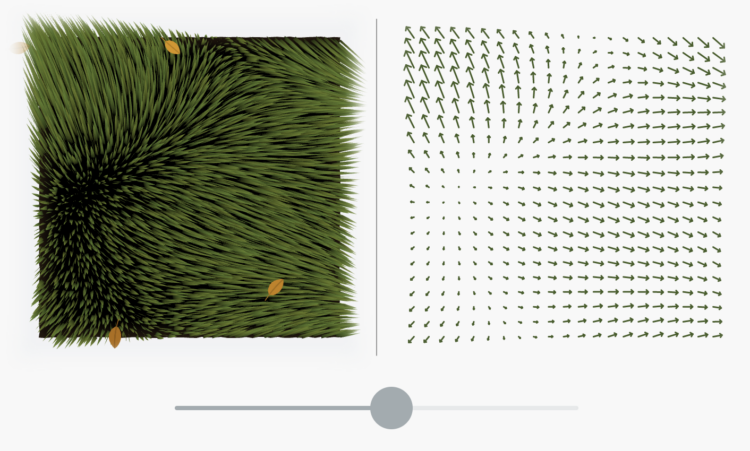
Bartosz Ciechanowski is at it again with an in-depth explainer that makes heavy use of slider-driven interactive graphics. This time he simulated the patterns of air flowing over and around the wings of an airplane, also known as airfoil.
The length of each article starts to feel kind of long at times, but there’s something to these simple sliders that are useful in keeping you engaged and helping to understand the physics.


