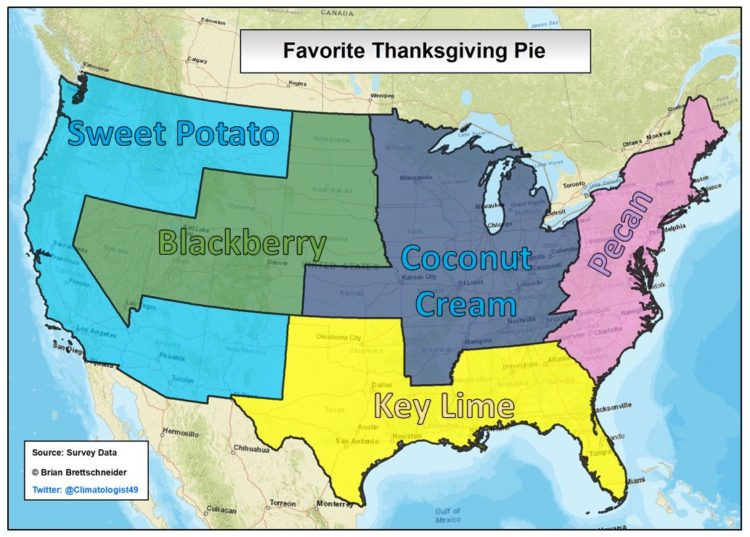
Brian Brettschneider made a joke map randomly designating the favorite pies of certain areas. While intended as a joke and a parody of past “favorite” maps, some people took it too seriously — like Senator Ted Cruz. Brettschneider describes the lessons he learned:
Maps hold a special standing among the public. We tend to place very high value in maps as holders of accurate information. If it’s in a map, it must be true, right? If I had tweeted a joke list of favorite pies by region, it would be very quickly ignored. Since it was in map form, it had an air of authenticity. This matters. As cartographers, we need to be cognizant of the power that maps have.
I had a similar experience years ago with Data Underload. These days I use the project as a catch-all for my own analyses, but I started it as a comic-ish chart series that I used to communicate anecdotes, opinions, and random stuff based on no actual data.
The form confused people at times, especially for those unfamiliar with the series, because it looked so much like charts based on real data. It was like reading a sarcastic comment online from someone you don’t know and trying to guess if it’s serious or not.
So now I keep the real-looking charts for real data unless it’s super obvious. Sometimes your choices on form can lead to unintended interpretations — like a joke taken as serious commentary.


